| StockFetcher Forums · Filter Exchange · Intersecting 1 month high with daily candle | << 1 2 >>Post Follow-up |
| snappyfrog 753 posts msg #147371 - Ignore snappyfrog |
4/13/2019 11:36:57 PM I want to find the day (red box on chart below) where the 1 month high intersects at a right angle to the candlestick. This is to try to get a 2 -5 day or more swing trade. Any help on how to write this, I would be most appreciative. 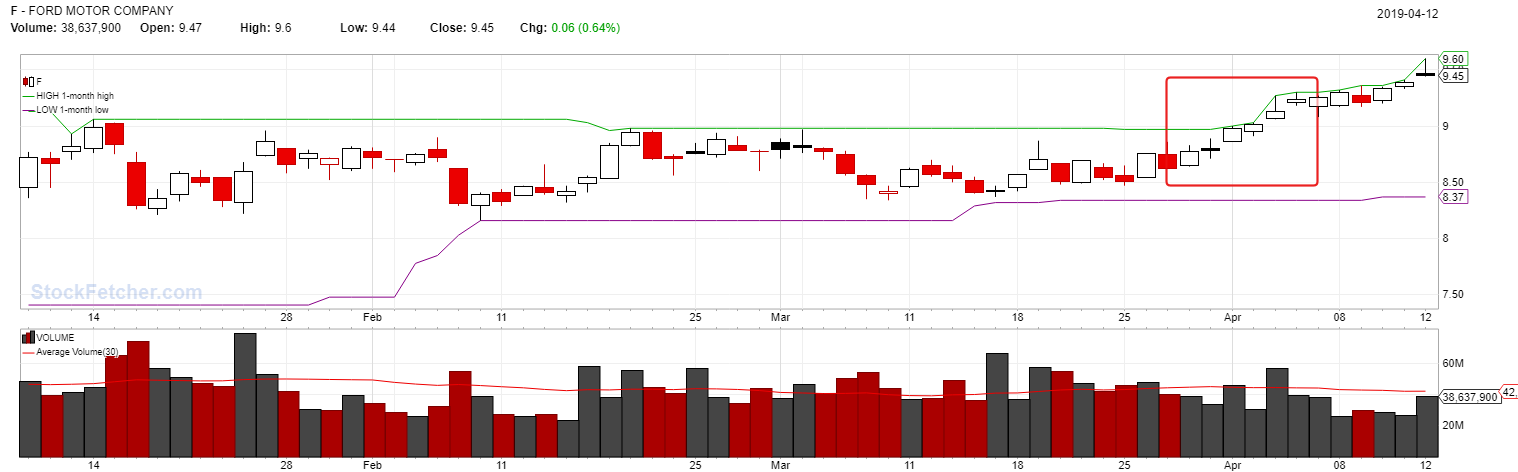 |
| Mactheriverrat 3,178 posts msg #147372 - Ignore Mactheriverrat |
4/14/2019 12:30:31 AM Submit See April 1 2019 of the above filter. Find the one that has hit high 20 DAY HIGH and put in on a symlist the follow the trend. Break down below the ema13 then let it go. 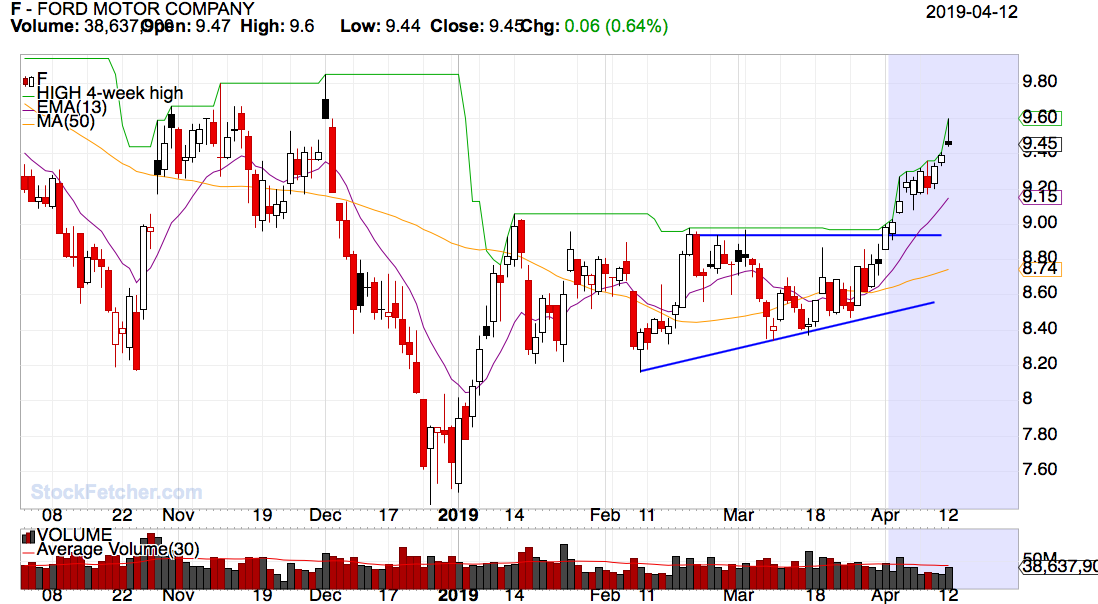 had to put a ascending triangle and the longer term Guppy Investors moving averages on this picture. 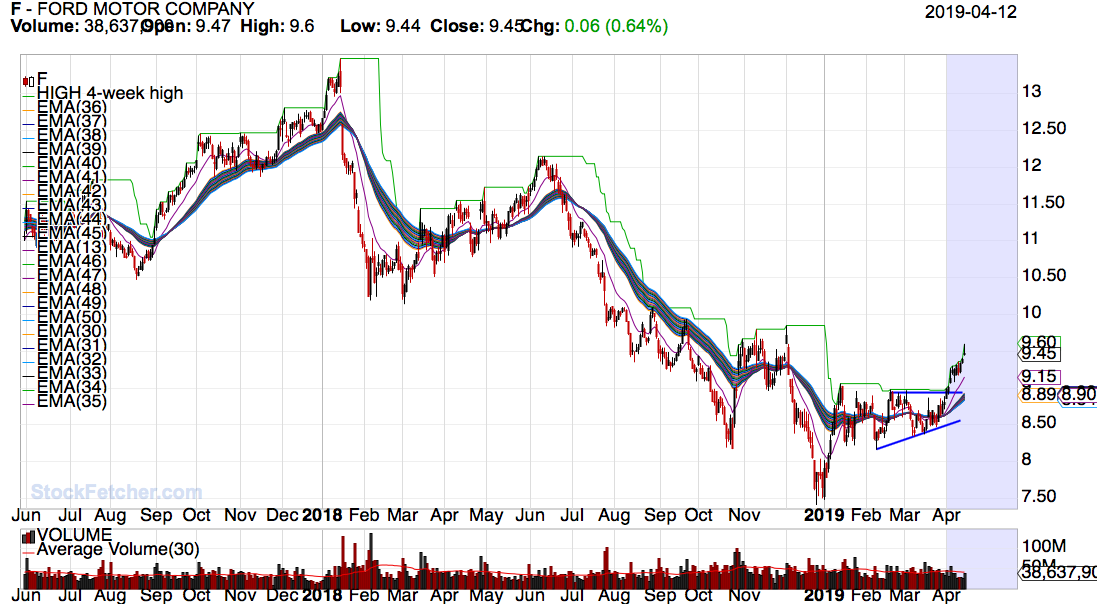 |
| Cheese 1,374 posts msg #147373 - Ignore Cheese |
4/14/2019 12:42:44 AM |
| Cheese 1,374 posts msg #147374 - Ignore Cheese |
4/14/2019 12:44:48 AM FWIW I posted my suggestion without knowing that Mac has already posted something. |
| snappyfrog 753 posts msg #147375 - Ignore snappyfrog |
4/14/2019 8:11:39 AM Thanks Mac & Cheese (see what I did there) lol. Both of the above filters picked Ford (F). Instead of having to sort through several hundred hits, I was hoping there was some way to find a stock like F when the 1 month high intersected it for the "first" time (red box). I tried using the slope of the 1 month high equals 0 also but without any luck. Thanks for your ideas! 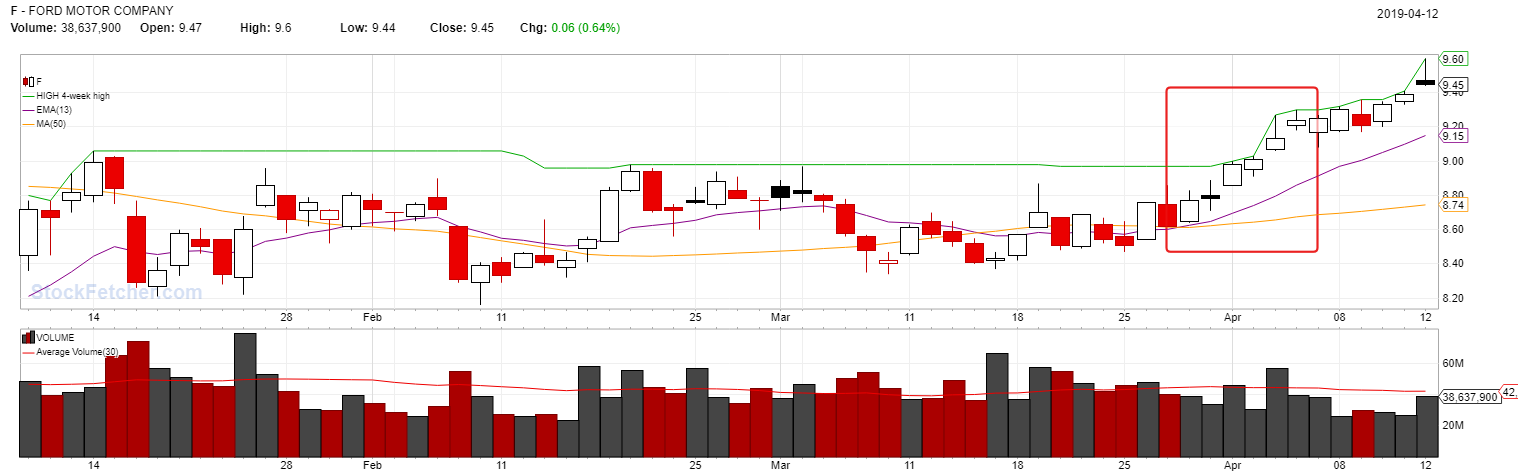 |
| snappyfrog 753 posts msg #147376 - Ignore snappyfrog |
4/14/2019 8:23:55 AM Well, I've gotten closer with this filter, but it missed picking up F (Ford) for some reason. Many less hits on this one though. 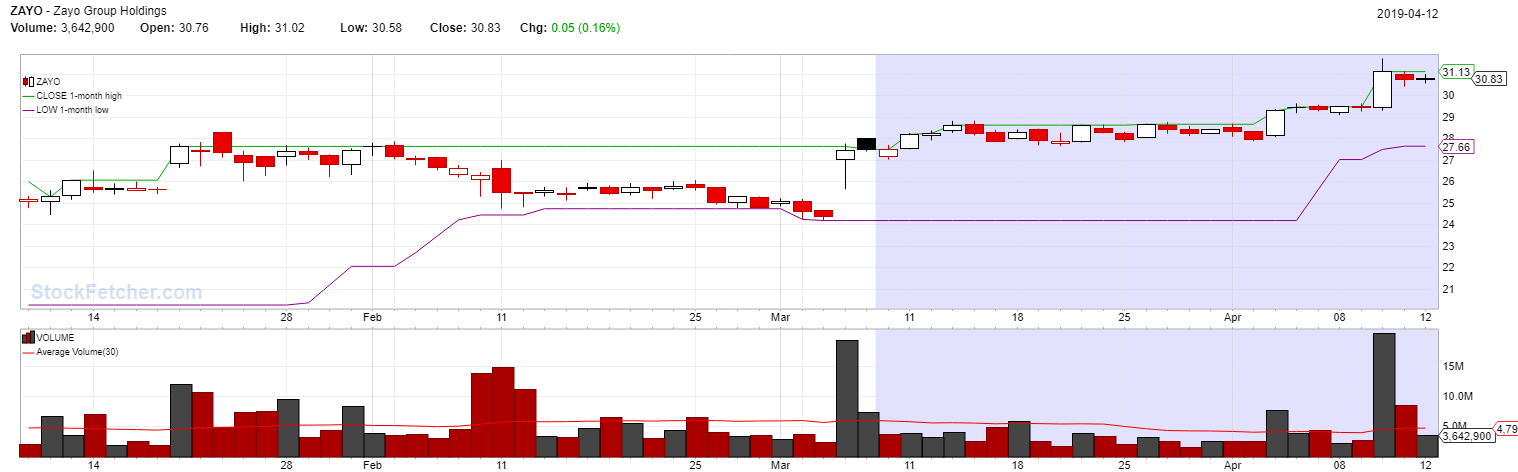 |
| snappyfrog 753 posts msg #147377 - Ignore snappyfrog modified |
4/14/2019 8:46:45 AM Well I think this fixes what I was looking to find. I must have been brain dead last nigh. Limited hits and picking the stock when the 1 month high intersects. Many less hits and the results are looking good so far. Thanks for your help - any improvements, please feel free to post. 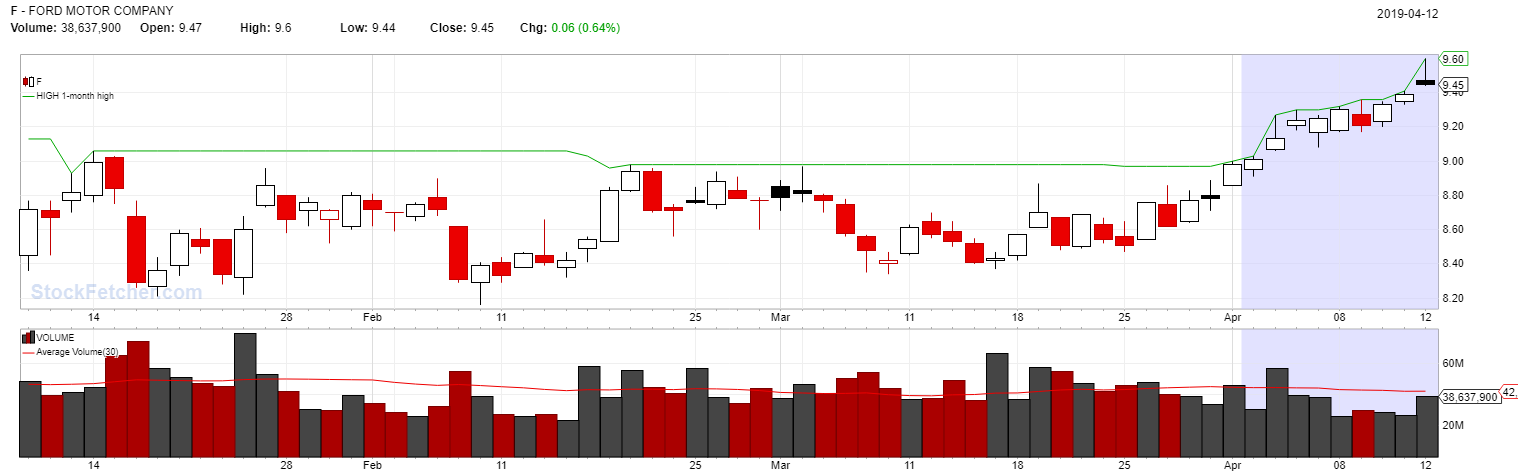 |
| nibor100 1,103 posts msg #147378 - Ignore nibor100 |
4/14/2019 9:53:33 AM 1. Is it your intent to eliminate any stocks that in the past 6 days have Highs equal to but not greater than the ongoing, High 1 month High, before today's new higher, High 1 month High? 2. I believe new high 1 month high lines won't actually intersect candles at right angles as the High 1 month high is drawn to touch the topmost tip of the candlestick; however, new Close 1 month highs, would probably have some intersection of today's candles that have Highs above their Closes, but probably still not at right angles. Thanks, Ed S. |
| snappyfrog 753 posts msg #147379 - Ignore snappyfrog |
4/14/2019 10:26:21 AM Nibor100 4/14/2019 9:53:33 AM 1. Is it your intent to eliminate any stocks that in the past 6 days have Highs equal to but not greater than the ongoing, High 1 month High, before today's new higher, High 1 month High? 2. I believe new high 1 month high lines won't actually intersect candles at right angles as the High 1 month high is drawn to touch the topmost tip of the candlestick; however, new Close 1 month highs, would probably have some intersection of today's candles that have Highs above their Closes, but probably still not at right angles. Thanks, Ed S. ********************** 1. Yes, after a pullback many times stocks will make a good run. So I am trying to find the next wave up on a stock, even if it is only for a few days (my style of swing trading). 2. Correct, it won't actually "intersect", but that was the best way I knew how to try to convey what I was seeing. I don't want to see the 1 month high "drop" to meet the candles as this many times shows a weakness in the run and they many times fail. Here is another example of what I like to see. 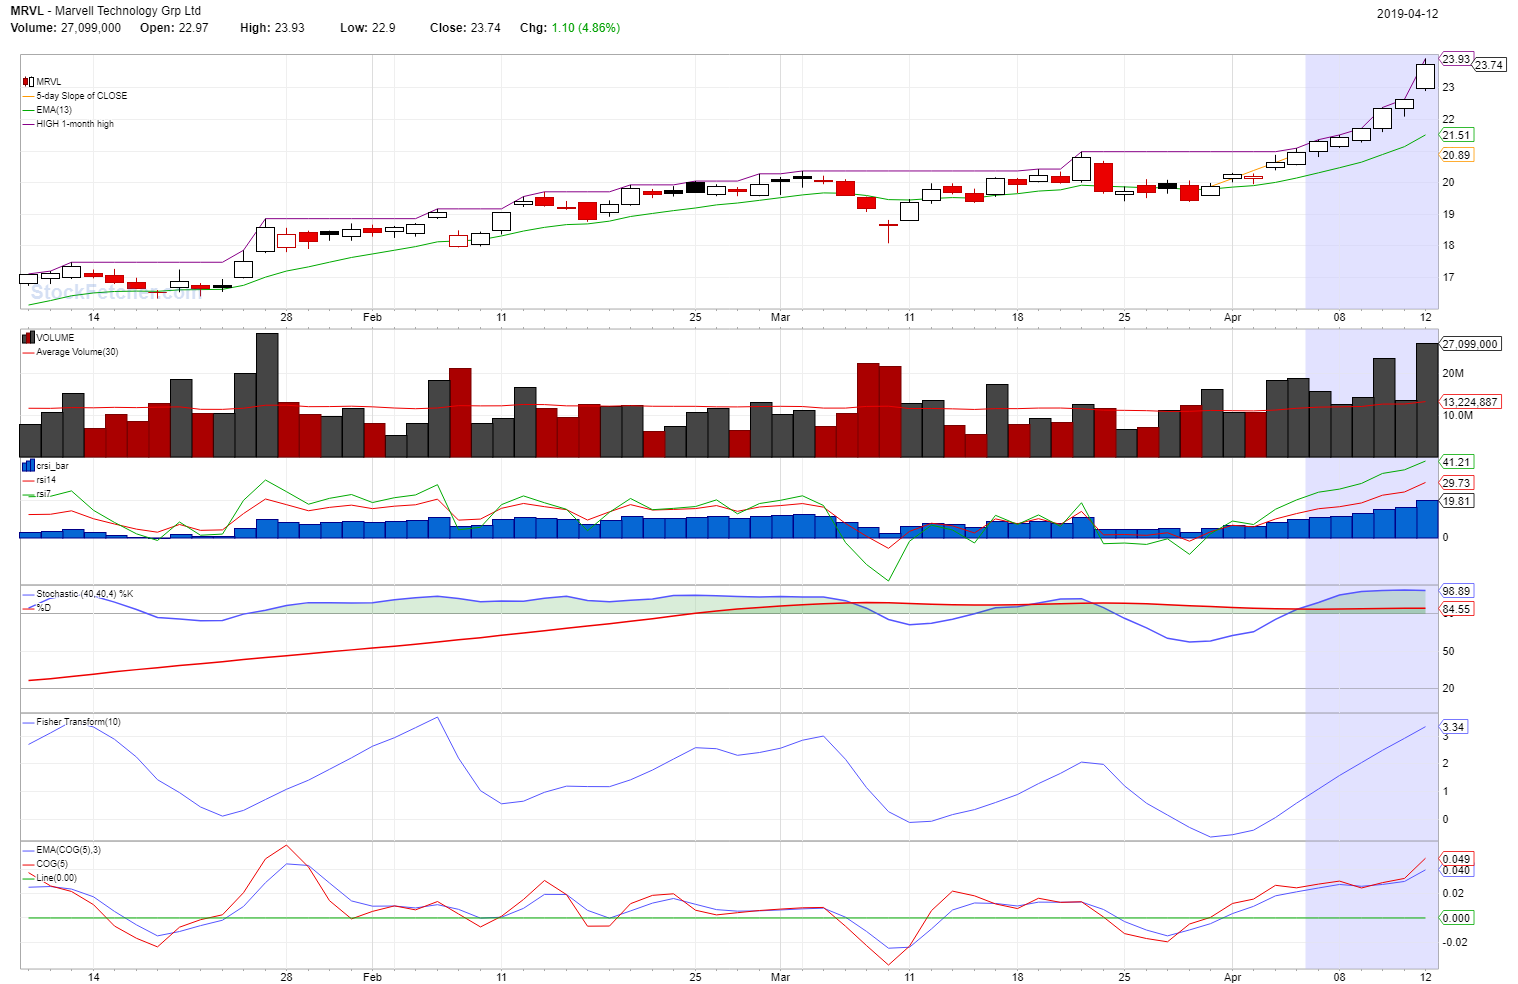 |
| snappyfrog 753 posts msg #147380 - Ignore snappyfrog |
4/14/2019 10:44:35 AM Here is an example of what I don't want to see. On EBAY the 1 month high line actually "drops" to meet the candles. This is a sign of weakness IMO that it couldn't make a new high within that 1 month period and as you can see, the stock price then drops. 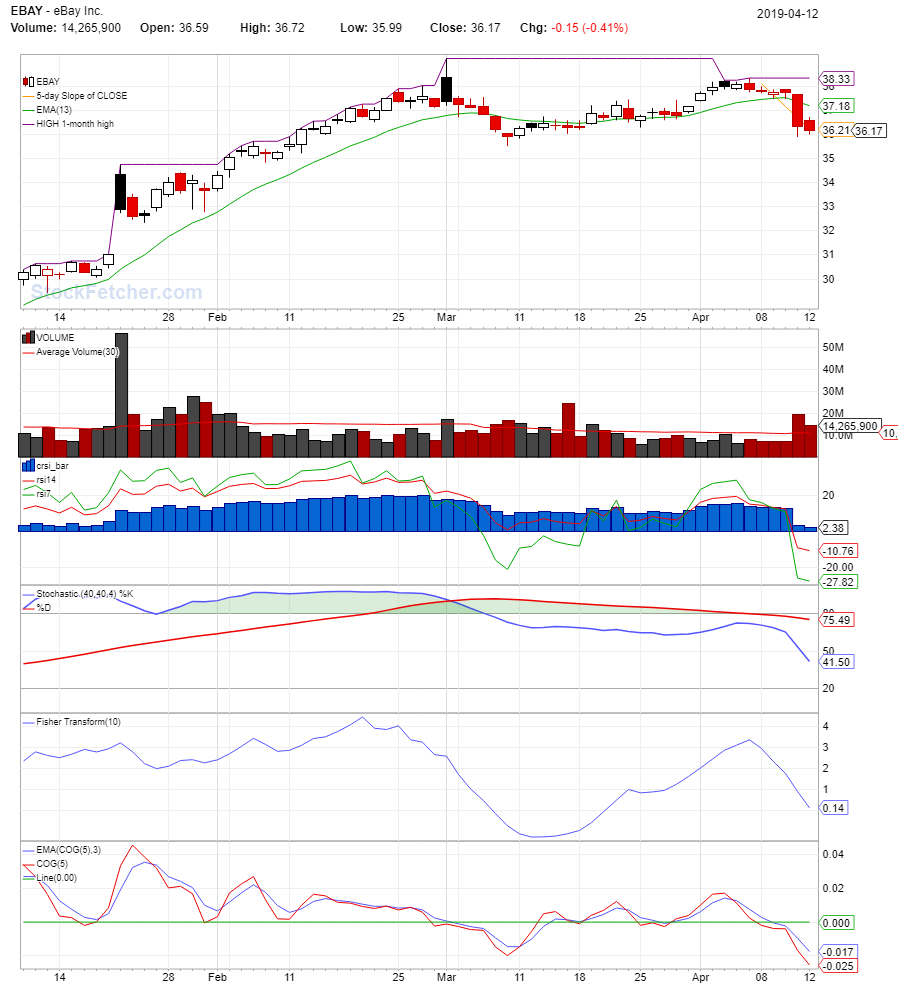 |
| StockFetcher Forums · Filter Exchange · Intersecting 1 month high with daily candle | << 1 2 >>Post Follow-up |