| StockFetcher Forums · Stock Picks and Trading · Picks and Pans Since Jan 2020 | << 1 ... 3 4 5 6 7 ... 29 >>Post Follow-up |
| xarlor 646 posts msg #150746 - Ignore xarlor modified |
2/11/2020 10:23:07 AM close-to-open gap is the command you are looking for. This filter checks for both a 9% (or worse) gap down and 9% gap up (or better) within the last 150 days. It does not check order though, so it could show a gap up first then a gap down or vice versa. Not sure what you mean by angle, but if you mean something like the angle of a trendline, then slope of might be of use. It doesnt use angles per se, but multipliers. For example a value of 1.0 means the value close to doubled from start to finish. |
| sandjco 648 posts msg #150751 - Ignore sandjco |
2/11/2020 6:29:52 PM @xarlor As always, thank you for the s. I will play around with it. RE: "angles" I was thinking....a filter that spits out stocks that just got out of a down trend and about rebound (like the bottom part of a "checkmark"...or the Nike "swoosh". Not sure if I am making sense... @svtsnakebitn Thanks for the kind words and dropping by! Yes, I prefer the visual looks of the T3s' (which I accidentally tripped over but still have no clue on how it is derived in plain English) over the EMAs. RE: what filter do I use to spit the ones I play? I haven't found one after two years or so here! The I shared (below) is the one I use to screen the stocks that I like and I literally scroll thru about 200 of them a day ( I know, not very efficient). I play stocks that may not have been generated by the filter or any filters I have. As I have shared, I am on a continuous journey of experimenting and I am a horrible "coder". Hence, I trade visually. For example, a few days ago, I played ROKU calls expiring this week for a quickie. I posted I would play but I honestly didn't know which strike price and expiry. I just bought what I could with what I wanted to risk. It turned out well but it could have been worse as well. I sold because I didn't want to hold over earnings plus things seem to fade the last time I checked. For today, without signals generated, I entered SPY Jul 309P I will use the price of $5.55 with SPY currently at 335. I also bailed on my RUSL for quick 10% loss; closed TLT Calls for a quick 30% If you are technically inclined, I would encourage you to read the volumes of filters here. I tried (and still am trying) but my feeble mind just could not grasp some of the concepts. Good luck on your journey! Hope I have helped in some ways! |
| sandjco 648 posts msg #150756 - Ignore sandjco modified |
2/12/2020 11:05:50 AM Can't post later...out of SPY puts for a 10% loss. Chalk it to trying to call the "top" craziness! Patience grasshopper! Long ALGN...Guppies turning? 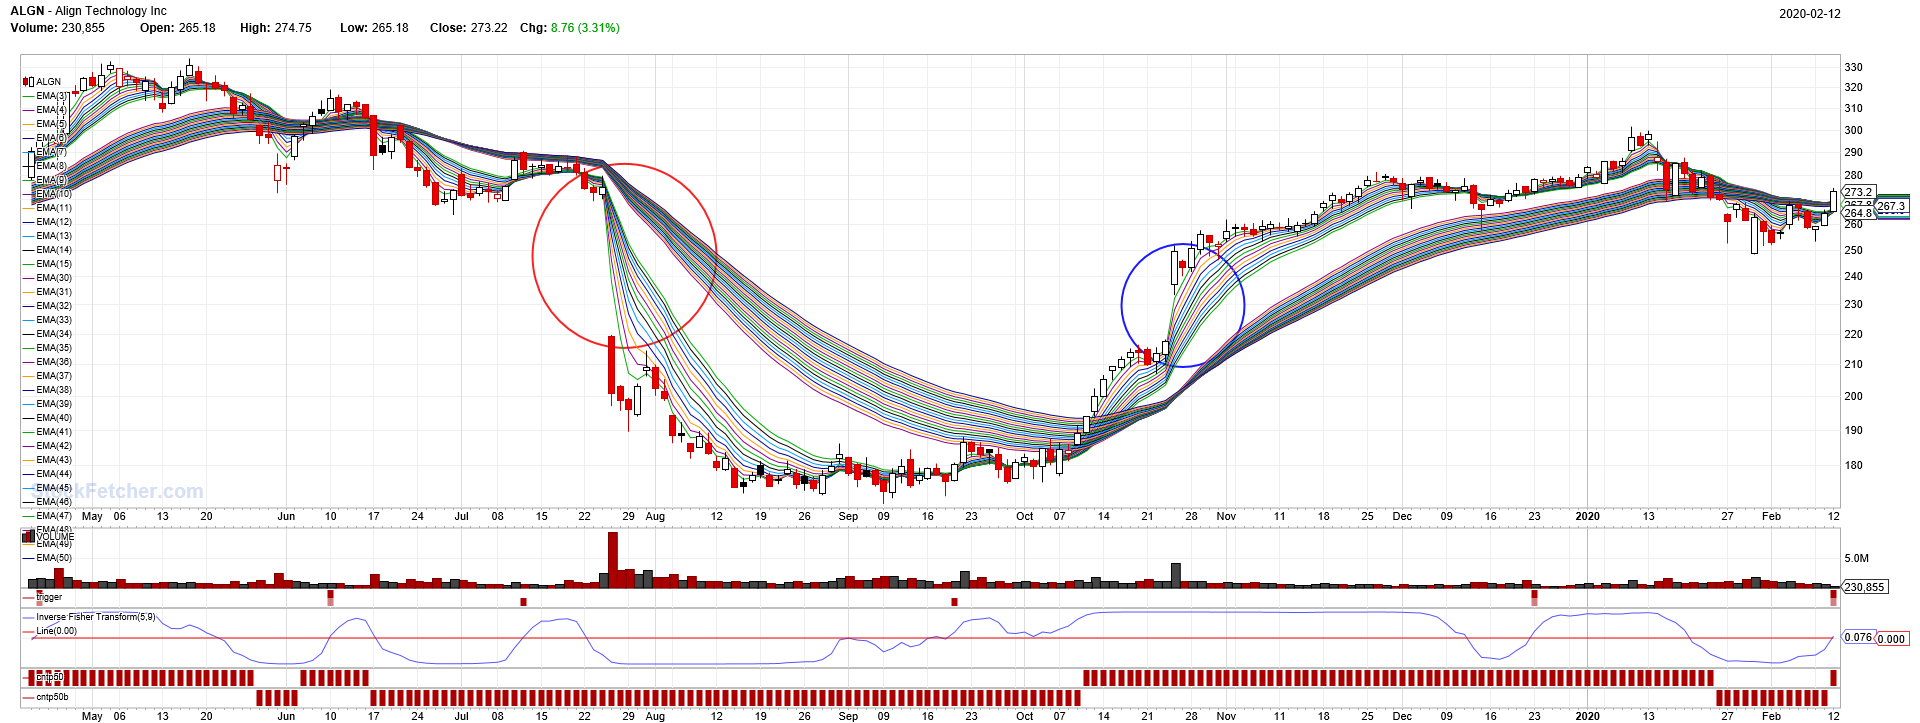 |
| sandjco 648 posts msg #150771 - Ignore sandjco |
2/13/2020 1:18:43 PM Closed AAPL Mar 320C for a wash. Buying ROKU Apr 160C $8.85 for an earnings play (against my rules!). |
| xarlor 646 posts msg #150777 - Ignore xarlor |
2/13/2020 3:37:41 PM Here is an approximation of your checkmark. |
| sandjco 648 posts msg #150778 - Ignore sandjco |
2/13/2020 4:36:24 PM Thanks Xarlor! Yoda man! We are getting somewhere...just need to figure out how to tighten the candies generated....first thing that I'm thinking is to buy the dip before it pops to the 30 day high (but I guess, in a way, reaching the 30 day high eliminates some false breakouts). Of course, I am open to suggestions.... Have to board now...hope ROKU kicked ass! Cheers! |
| xarlor 646 posts msg #150781 - Ignore xarlor |
2/13/2020 5:40:10 PM If you want the dip, just have to reverse the filter and tweak a bit. This looks promising, though you have to monitor if it bounces off the resistance (it does quite often). Still, you can buy the dip and sell at resistance for a tidy gain. |
| sandjco 648 posts msg #150785 - Ignore sandjco |
2/14/2020 12:37:03 PM Thanks Xarlor! ROKU beats...up AH and then boom...hits the crapper. Im down 30%...hmmm. To add or not to add.... 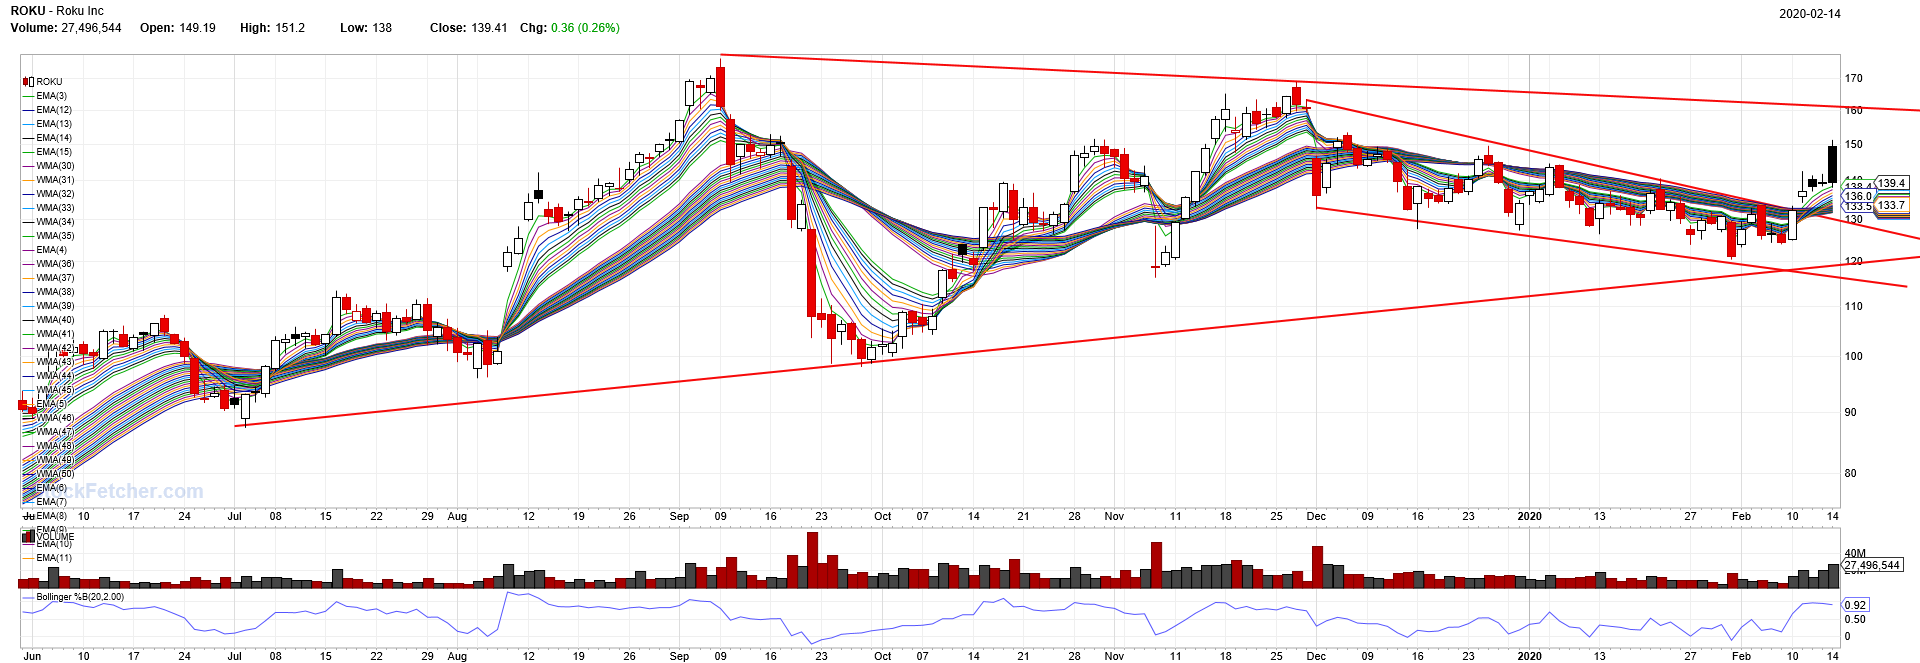 SPCE on the other hand...got filled Mar 24C for a quickie 60% 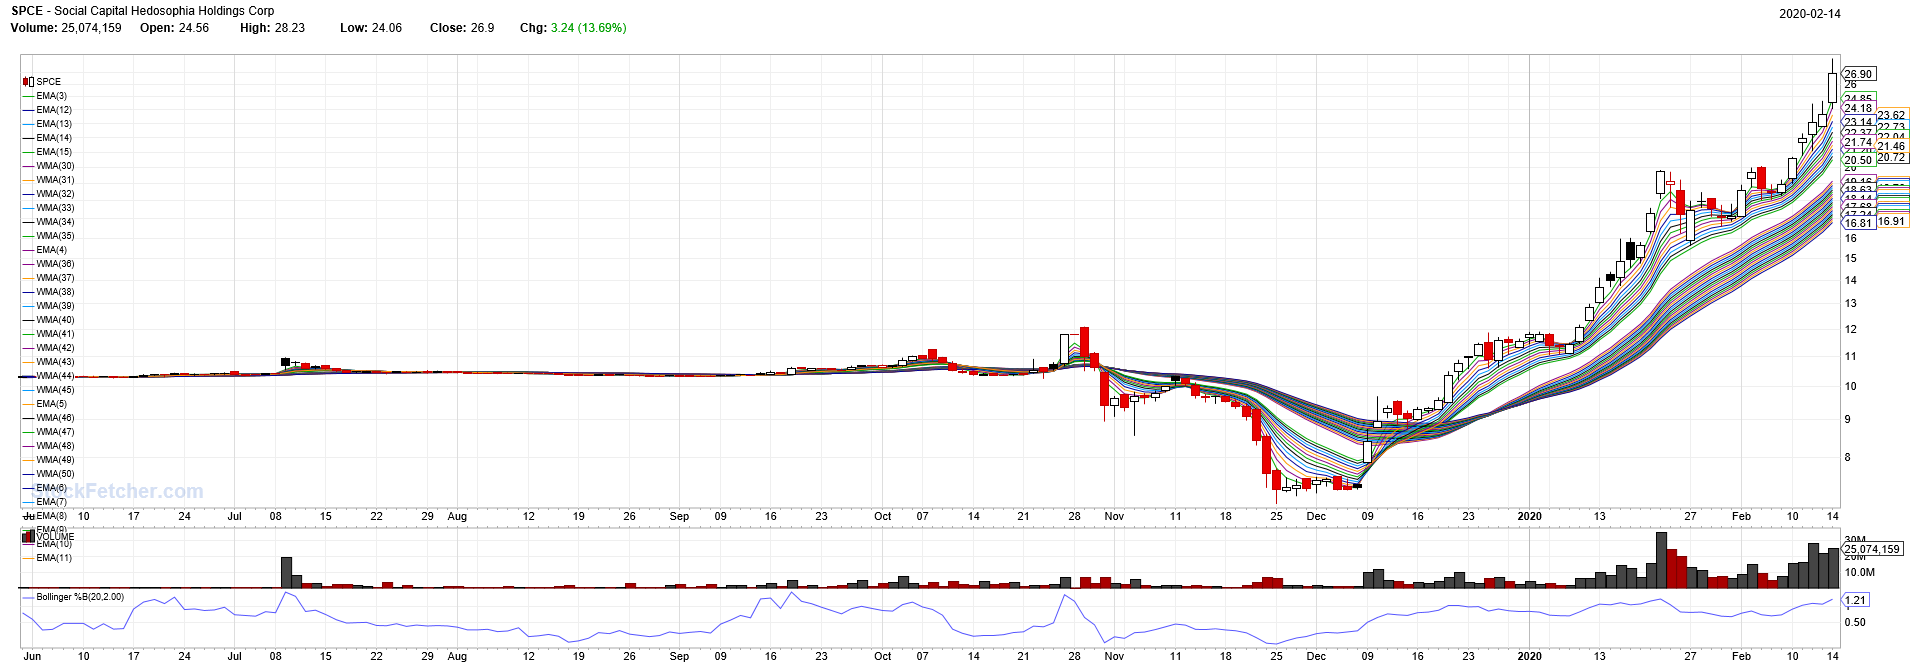 |
| sandjco 648 posts msg #150797 - Ignore sandjco |
2/15/2020 11:06:00 AM Most of the time, when you don't follow the rules...you will get your bum handed to you. ROKU...beats but Mr. Markets seems to dislike the results. Up AH (note to self...don't get excited with this thinly traded market) and then faded and got shafted during the day. 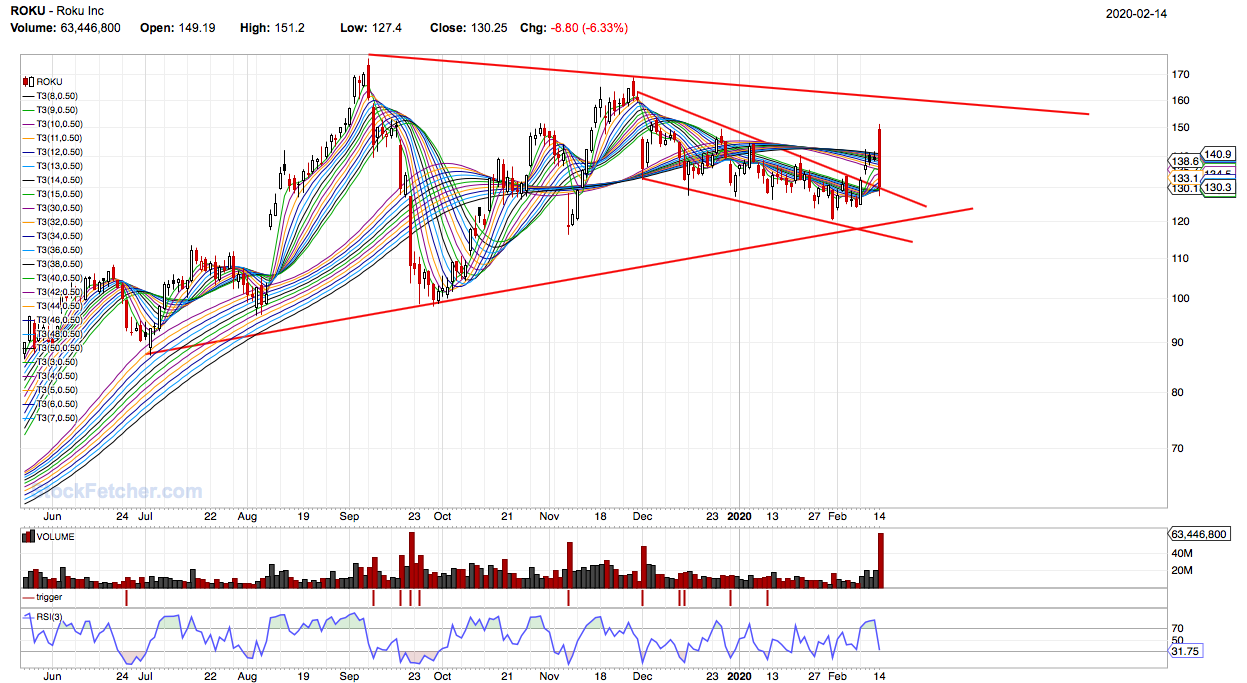 Keeping my Call position despite the 50% haircut (should be selling based on my "rules") and see how it goes before I totally bail or add within the next 3 days. Markets haven't corrected at all despite the climbing toll of the Coronavirus...which may lead to a slowdown in China. When China sneezes.... Meanwhile, TSLA brilliantly took advantage of higher share prices to sell more shares...at $767. I know analysts are mainly looking at TSLA = EVs....I am more excited about its future using its advantage in batteries as huge power supplies replacing traditional grids. 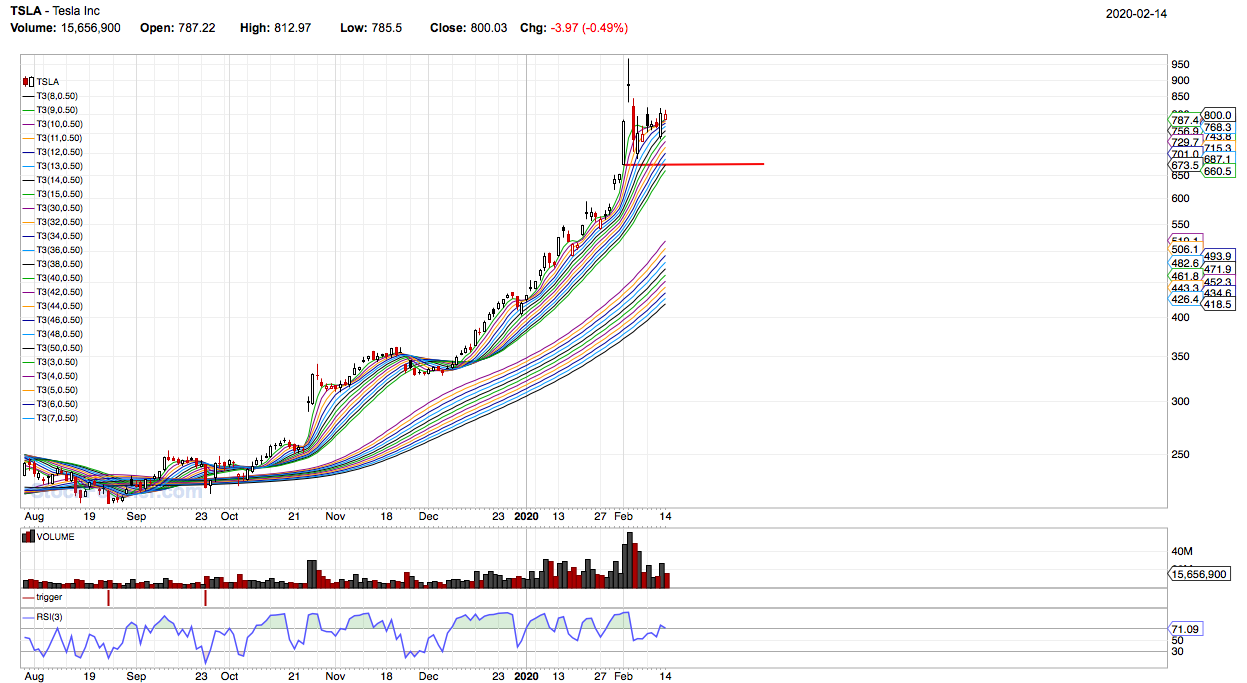 Will PAYC resume its uptrend? So far, 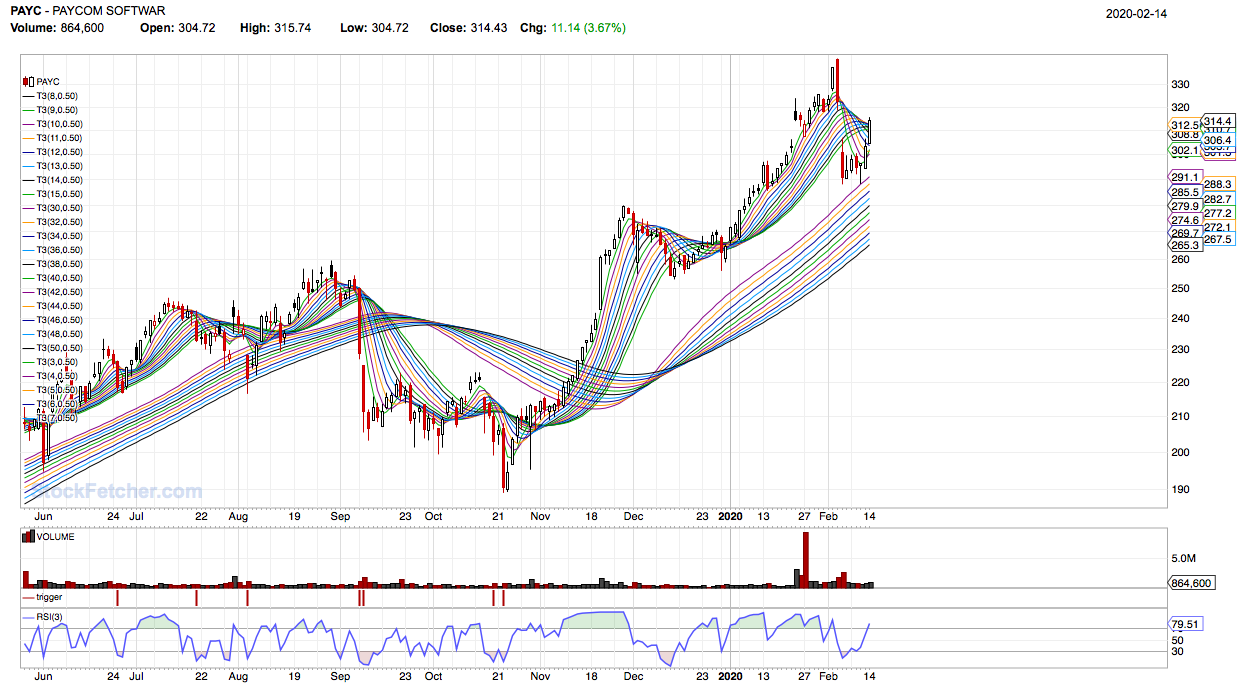 Will TNDM finally breakout? 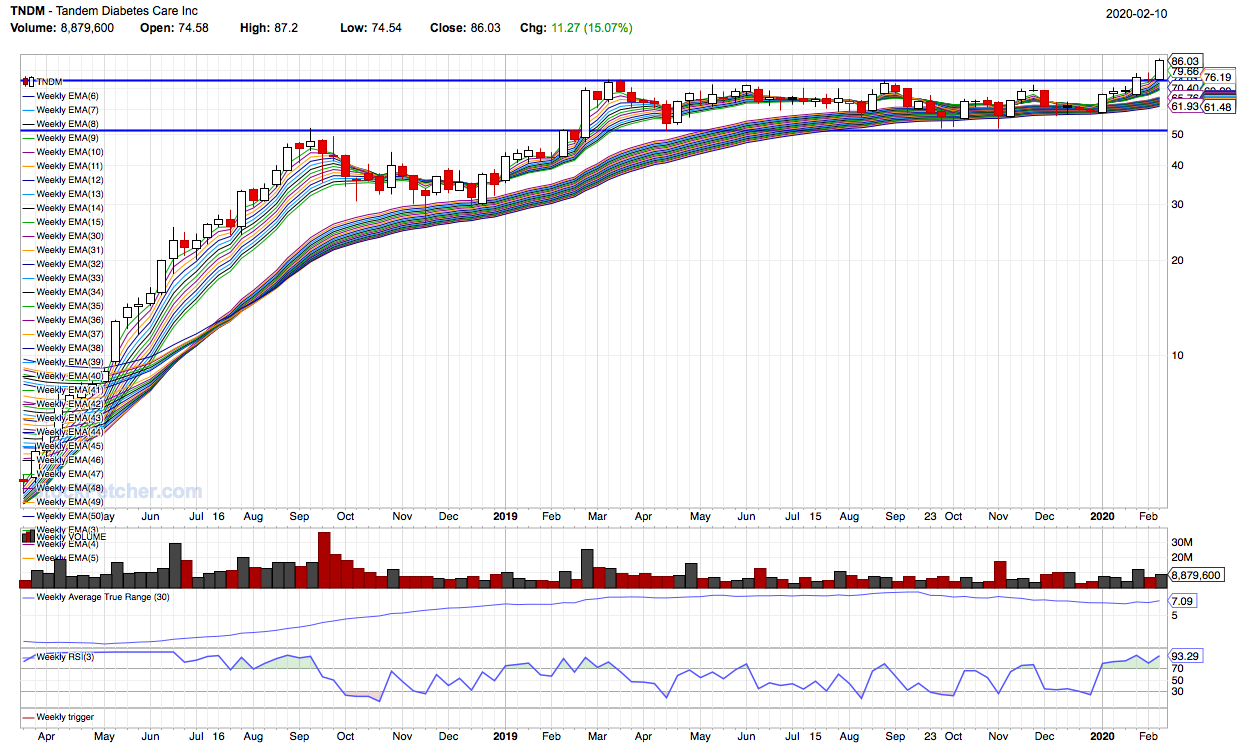 NVDA beat... 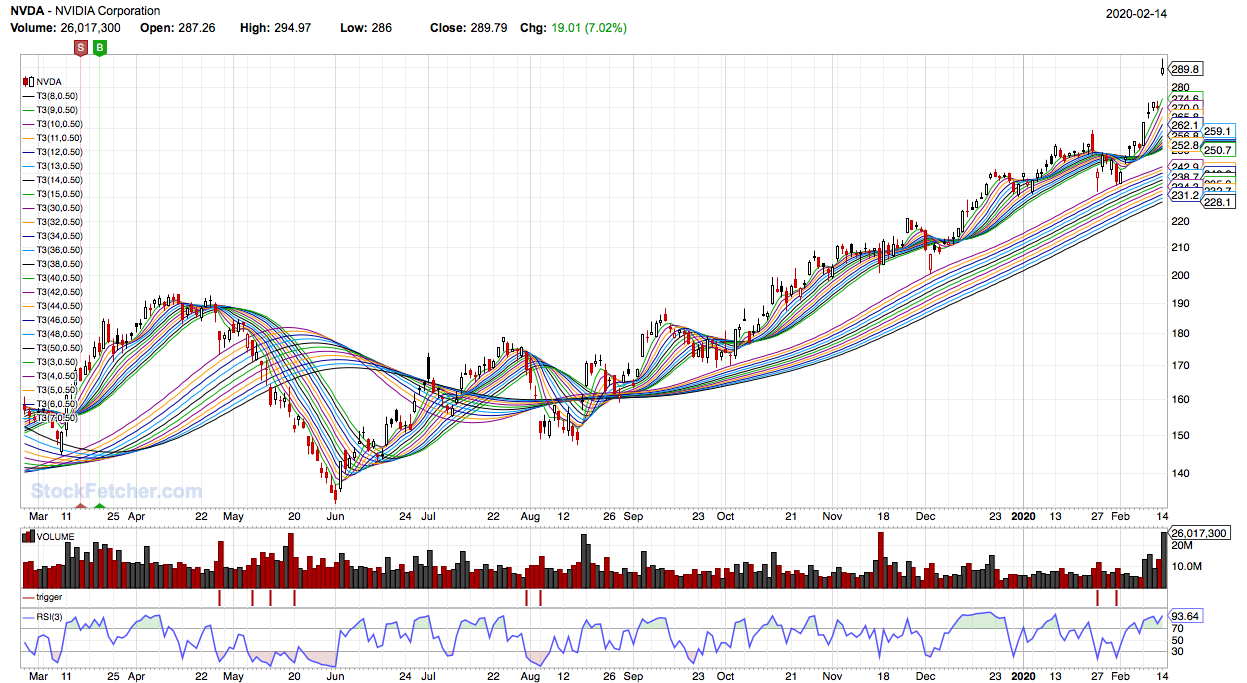 |
| sandjco 648 posts msg #150798 - Ignore sandjco |
2/15/2020 11:37:34 AM On ROKU add on or not... From four ...not too long ago... 6/27/2017 10:53:44 PM My plan was to "build" the position -- What happens to your model when we flip it. Same rules... but buy on a percent move up, not down. Do you wish to buy more of a stock that is going up OR more of a stock that is going down? Another view point: There is a famous picture of Paul Tudor Jones relaxing in his office with his feet kicked up. A single sheet of loose-leaf paper is tacked on the wall behind him with the simple phrase written out in black marker: �Losers Average Losers�. Famed trader Jesse Livermore warned 100 years ago against averaging losses. Losers Average Losers: Paul Tudor Jones - Trend Following https://www.trendfollowing.com/losers_average_losers/ |
| StockFetcher Forums · Stock Picks and Trading · Picks and Pans Since Jan 2020 | << 1 ... 3 4 5 6 7 ... 29 >>Post Follow-up |