StockFetcher Forums · Stock Picks and Trading · CLVS<< 1 2 3 >>Post Follow-up
Mactheriverrat
3,132 posts
msg #149664
Ignore Mactheriverrat
11/22/2019 12:55:24 PM
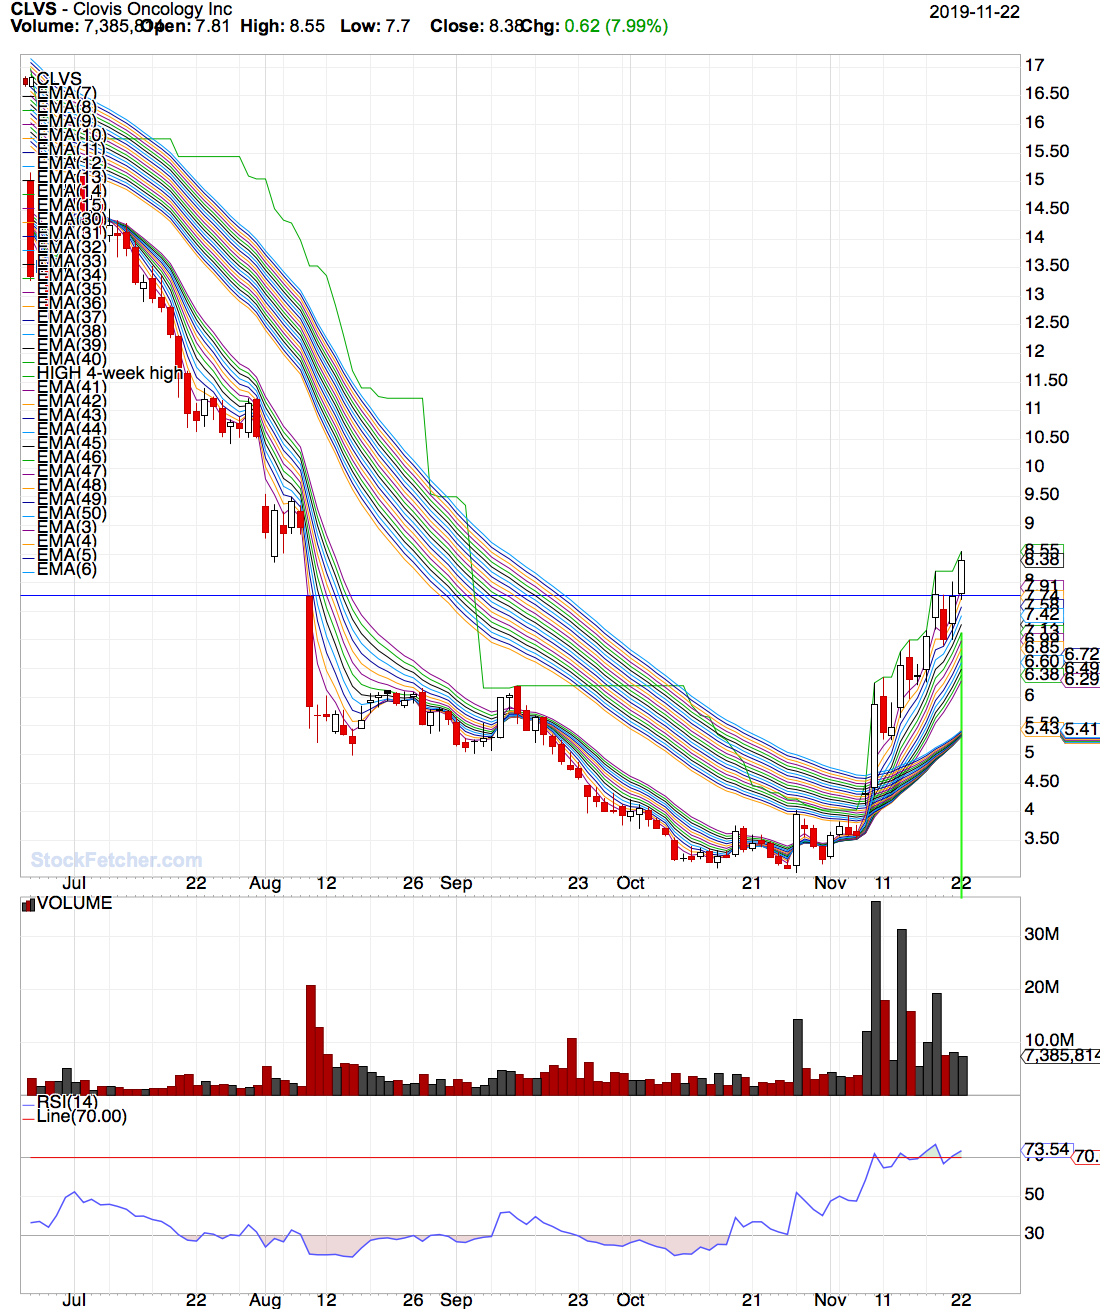


Mactheriverrat
3,132 posts
msg #149682
Ignore Mactheriverrat
11/25/2019 10:24:56 PM
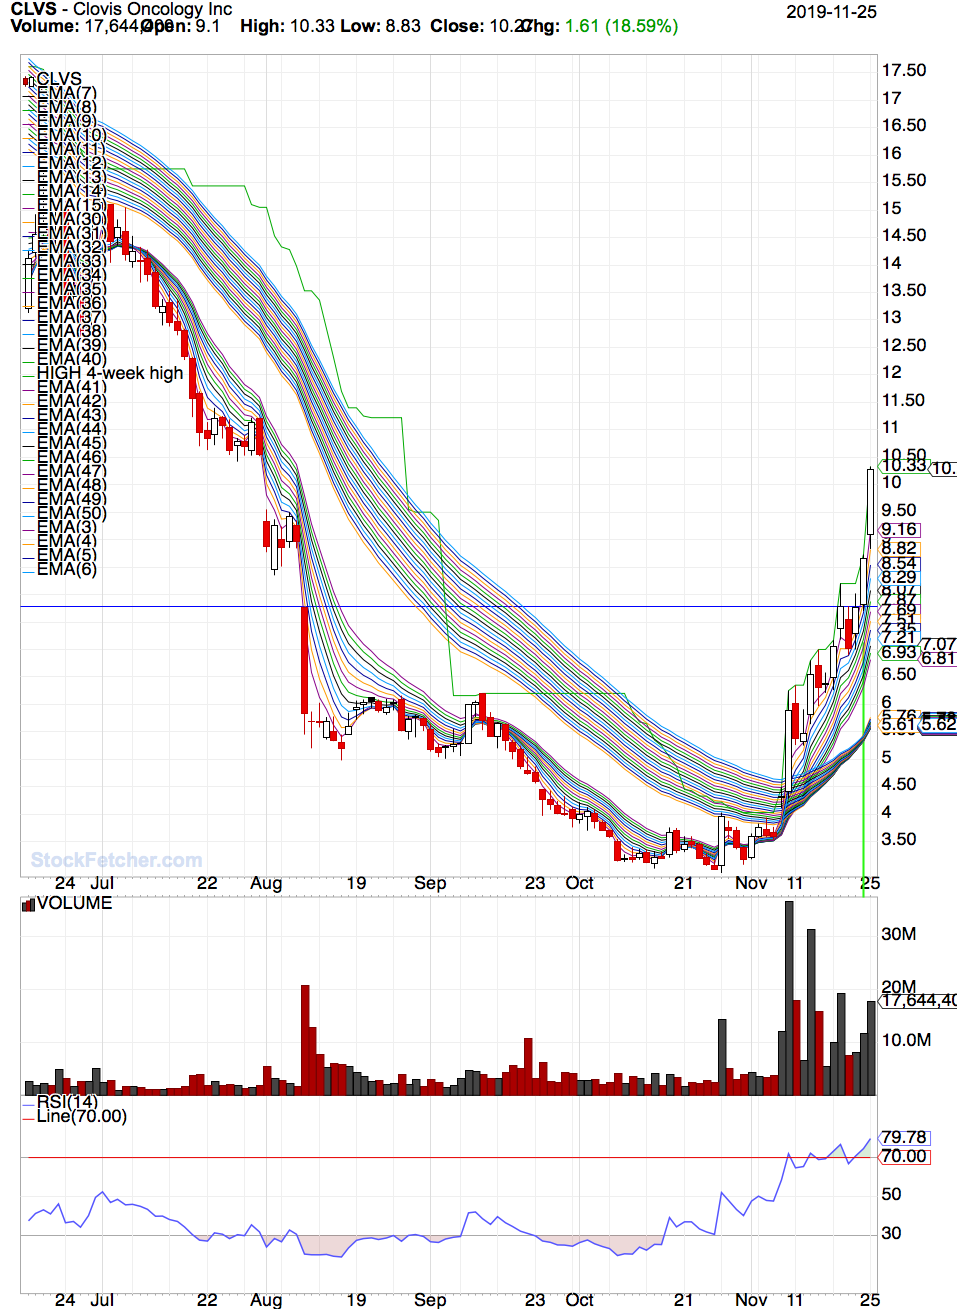


sandjco
648 posts
msg #149685
Ignore sandjco
modified
11/26/2019 12:06:27 PM

Great catch on this Mac! Thank you!

Question...what did this have that SPRT didn't show?
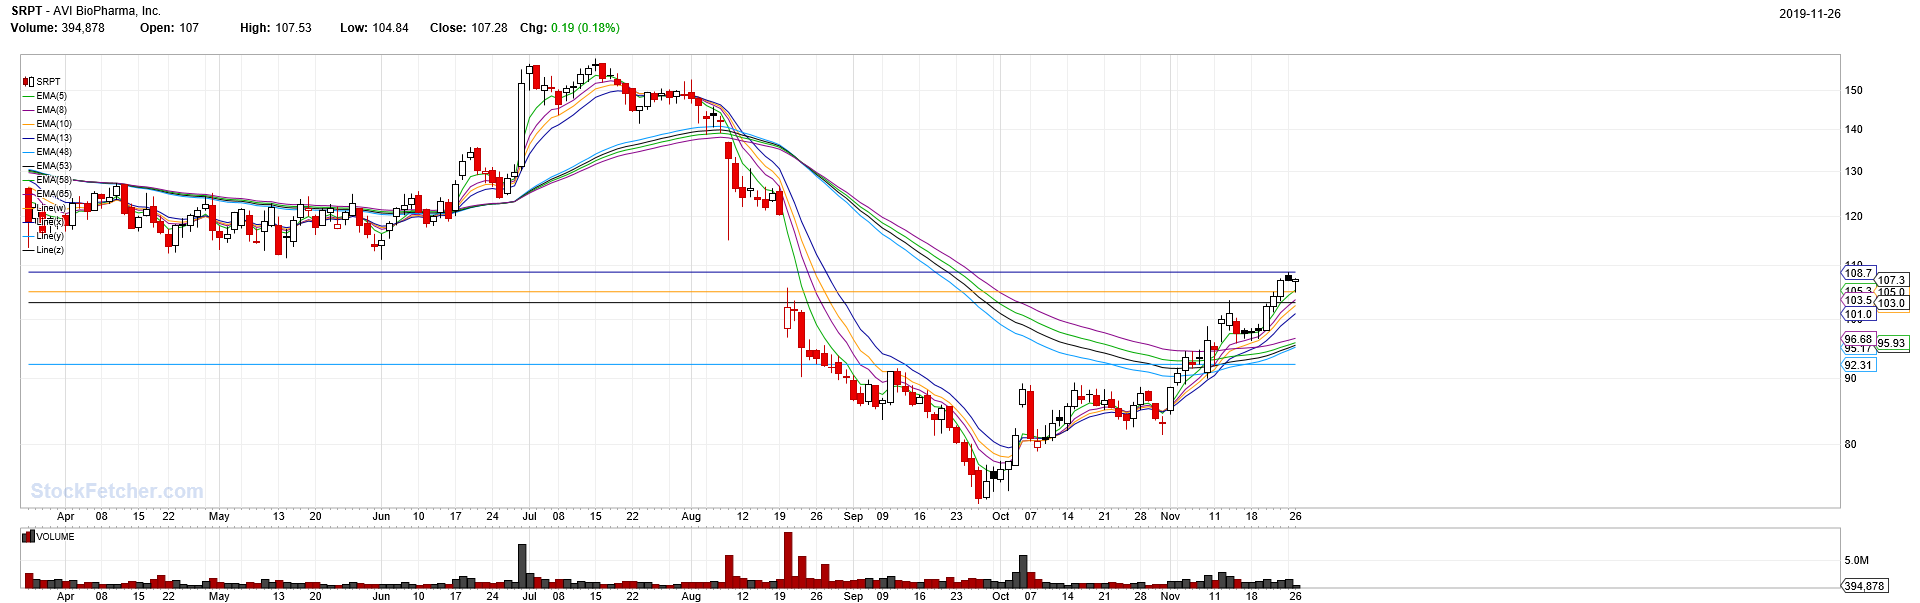

Mactheriverrat
3,132 posts
msg #149688
Ignore Mactheriverrat
11/26/2019 3:57:26 PM

CLVS has a Average Day Range(30) of 12.49
SPRT has a Average Day Range(30) of 3.37

Great catch of SPRT.

The Guppy helps in showing the trend change.

Mactheriverrat
3,132 posts
msg #149689
Ignore Mactheriverrat
11/26/2019 4:01:18 PM

CLVS is a past runner - Look at a 7 year chart-

https://stockcharts.com/h-sc/ui?s=CLVS&p=D&yr=7&mn=7&dy=0&id=p14893051249

sandjco
648 posts
msg #149690
Ignore sandjco
11/26/2019 4:50:29 PM

Thanks Mac; CLVS was one of my trades when it was in the 80's.

Great call on the ascending triangle on the SPOOs.

xarlor
561 posts
msg #149692
Ignore xarlor
11/26/2019 8:50:34 PM

Mac, is there a filter you use to catch these breakouts?

I've pieced together one based on your criteria mentioned over the last several posts.

  • Guppy trend reversal
  • Break above 3-month high
  • Day range exceeds the average 30-day range

    This filter caught CLVS and RLGY, but missed MRNA (too much separation between guppy cross and 3-month break). It also found some other gems:

  • 10/18/19 STT
  • 10/25/19 URI
  • 10/28/19 FIT
  • 10/30/19 TAK
  • 11/13/19 HALO
  • 11/14/19 QGEN
  • 11/15/19 LK
  • 11/19/19 LABU

    Of course, as with any filter there are losers in there. I feel with a good stop loss plan this would make a good strategy for breakouts.

    Anyway, here is the filter:

    Fetcher[
    /* River Rat wants a new boat */

    chart-time is 4 months
    average volume(30) > 1234567
    close > 5

    set{3mh,high 3 month high}
    close crossed above 3mh 1 day ago
    close crossed above wma(150) within the last 7 days
    close > wma(150) for last 2 days
    close-to-open gap < 10
    day range > Average Day Range(30)

    draw price line at 3mh 1 day ago

    /*TRADER GROUP*/
    draw EMA(3)
    draw EMA(5)
    draw EMA(8)
    draw EMA(10)
    draw EMA(12)
    draw EMA(15)

    /*INVESTOR GROUP*/
    draw EMA(60)
    draw EMA(50)
    draw EMA(45)
    draw EMA(40)
    draw EMA(35)
    draw EMA(30)

    do not draw high 3 month high
    do not draw average day range(30)
    do not draw day range
    do not draw 3mh
    do not draw close-to-open gap
    ]


  • Mactheriverrat
    3,132 posts
    msg #149693
    Ignore Mactheriverrat
    11/27/2019 3:32:07 AM


    Submit
    Fetcher[
    /* This filter consists of EMA(17) above EMA(50) and the long term Guppy Moving averages compressing. */
    draw high 20 DAY HIGH

    and ema(17) is above ema(50)
    chart-time is 7 months
    draw ema(3)
    draw ema(4)
    draw ema(5)
    draw ema(6)
    draw ema(7)
    draw ema(8)
    draw ema(9)
    draw ema(10)
    draw ema(11)
    draw ema(12)
    draw ema(13)
    draw ema(14)
    draw ema(15)


    draw ema(30)
    draw ema(31)
    draw ema(32)
    draw ema(33)
    draw ema(34)
    draw ema(35)
    draw ema(36)
    draw ema(37)
    draw ema(38)
    draw ema(39)
    draw ema(40)
    draw ema(41)
    draw ema(42)
    draw ema(43)
    draw ema(44)
    draw ema(45)
    draw ema(46)
    draw ema(47)
    draw ema(48)
    draw ema(49)
    draw ema(50)
    market is not otcbb
    market is not etf
    volume is above 250000
    add column Average Day Range(30)
    Average Day Range(30) is above 3.00
    do not draw Average Day Range(30)

    Draw RSI(14) line at 70.00
    Draw RSI(14) line at 50.00


    Set{cntema17ema50,count( ema(17) > ema(50) ,1)}
    draw cntema17ema50

    Set{cntema17ema50b,count( ema(17) < ema(50) ,1)}

    draw cntema17ema50b

    * GxG is number of consecutive days ema(17) above (+)/below(-) previous EMA(50) */
    set{GGb,days( ema(17) is above EMA(50) ,250)}
    set{GGa,days( ema(17) is below EMA(50) ,250)}
    set{17x50, GGa - GGb} and add column 17x50 {17_x_50}

    do not Draw GxG


    ]


    Mactheriverrat
    3,132 posts
    msg #149704
    Ignore Mactheriverrat
    11/27/2019 11:17:50 PM

    I have found that the EMA 17 cross above the EMA 50 is just about where the Traders group and the Investors group separate from each other . You know that little clear gap between the 2 groups. The EMA 17 cross above the EMA 50 isn't in stone but I use as a starting point . The stock can still fail. Guppy MMA show that the trend is changing. I post a video about a week ago and Mr Guppy was showing a class on using Guppy MMA. He had no price candles just the Guppy MMA 2 groups. It was a very good video I thought. No price , no indicators and no Oscillators.

    Mactheriverrat
    3,132 posts
    msg #149706
    Ignore Mactheriverrat
    11/28/2019 3:32:33 AM


    StockFetcher Forums · Stock Picks and Trading · CLVS<< 1 2 3 >>Post Follow-up

    *** Disclaimer *** StockFetcher.com does not endorse or suggest any of the securities which are returned in any of the searches or filters. They are provided purely for informational and research purposes. StockFetcher.com does not recommend particular securities. StockFetcher.com, Vestyl Software, L.L.C. and involved content providers shall not be liable for any errors or delays in the content, or for any actions taken based on the content.


    Copyright 2022 - Vestyl Software L.L.C.Terms of Service | License | Questions or comments? Contact Us
    EOD Data sources: DDFPlus & CSI Data Quotes delayed during active market hours. Delay times are at least 15 mins for NASDAQ, 20 mins for NYSE and Amex. Delayed intraday data provided by DDFPlus


    This site is protected by reCAPTCHA and the Google Privacy Policy and Terms of Service apply.