| StockFetcher Forums · Stock Picks and Trading · BZUN WEEKLY buy signal | << 1 2 3 4 >>Post Follow-up |
| Mactheriverrat 3,178 posts msg #138036 - Ignore Mactheriverrat |
9/7/2017 11:38:27 PM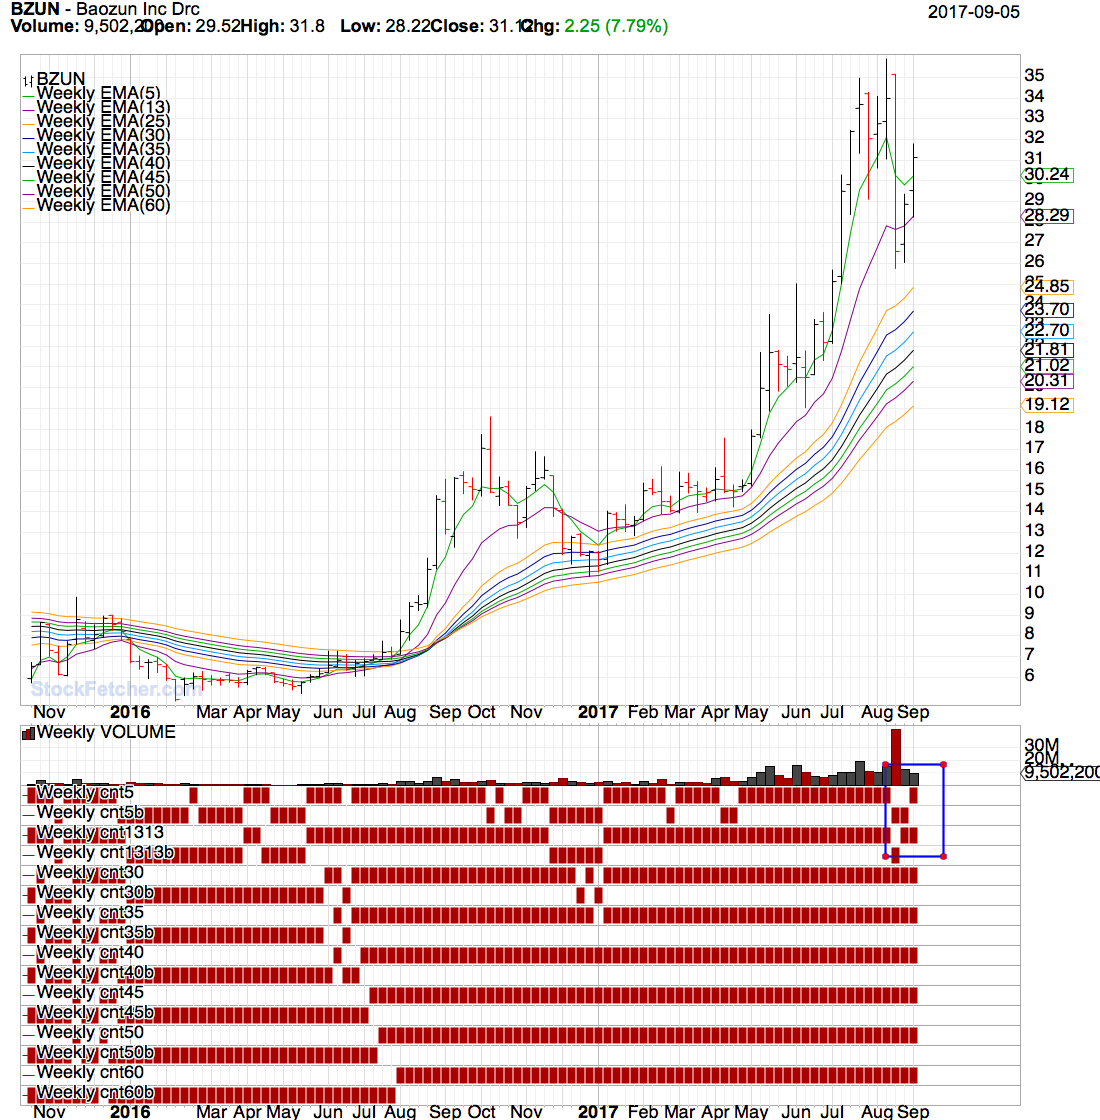 |
| johnpaulca 12,036 posts msg #138055 - Ignore johnpaulca |
9/8/2017 1:23:45 PM Symbol Last Chg(%) Vol Average Volume(10) Perf(%) MyRatings BZUN - Baozun Inc Drc 31.12 7.61 4,036,800 3,146,030 3.25 BDX - Becton Dickinson and Co 199.57 0.17 968,300 818,180 2.05 MCK - MCKESSON HBOC INC 155.84 2.47 2,462,400 1,412,630 0.99 PCAR - PACCAR Inc 66.83 2.44 2,341,800 1,477,070 0.94 MMM - 3M, MINNESOTA MNG & MFG CO 204.46 1.19 1,701,500 1,456,440 0.73 VRSK - Verisk Analytics 82.00 1.16 893,300 811,180 0.72 GLPI - Gaming And Leisu 38.29 0.31 1,117,800 818,410 0.60 HON - HONEYWELL INTERNATIONAL 137.08 0.39 2,460,300 2,134,340 0.53 ************************************************************************************************************************** Good call John BZUN made my Booya list yesterday |
| ron22 255 posts msg #138063 - Ignore ron22 |
9/8/2017 5:01:31 PM John or Mac, what thread is this filter on? Thanks Ron |
| pthomas215 1,251 posts msg #138064 - Ignore pthomas215 |
9/8/2017 6:22:10 PM Ron, I think Mac just noticed it was going to bust up after looking at technicals..i.e. no filter. However it did pop up in one of mine that probably originated from Graftonian. |
| Mactheriverrat 3,178 posts msg #138065 - Ignore Mactheriverrat modified |
9/8/2017 7:24:51 PM It popped up on a symlist I have of past runners. I liked the price action from Thursday of up 7.60% then I switched to a weekly chart on which the weekly ema(5) made a cross to the up side. Should see more upside next week. Friday is always a give and take day as a lot of traders just don't want to be holding over the weekend. It showed up on a Run Forest, Run , a Deadly Combo filter , a Show stocks where ema(13) is above ema(13) one day ago filter, a /* TRO MTC CHECKER */ filter - all with ADR(30) above 4.00 Then I watch the weekly filters and below code for a weekly eMA(5) cross. /* DxD is number of consecutive days ema(13) above (+)/below(-) previous EMA(13) */ set{DDb,days( weekly ema(13) is above weekly EMA(13) 1 day ago,250)} set{DDa,days( weekly ema(13) is below weekly EMA(13) 1 day ago,250)} set{DxD, DDa - DDb} and add column DxD {D_x_D} do not Draw DxD Set{cnt5,count( weekly eMA(5) > weekly eMA(5) 1day ago,1)} draw cnt5 Set{cnt5b,count( weekly eMA(5)< weekly EMA(5) 1day ago,1)} draw cnt5b Set{cnt1313,count( weekly eMA(13) > weekly eMA(13) 1day ago,1)} draw cnt1313 Set{cnt1313b,count( weekly eMA(13)< weekly EMA(13) 1day ago,1)} draw cnt1313b |
| pthomas215 1,251 posts msg #138066 - Ignore pthomas215 |
9/8/2017 7:33:03 PM especially this weekend! ...9/11 anniversary, hurricane, north korea threat. nice call on that one John...it was a great choice for a crap day overall. |
| Mactheriverrat 3,178 posts msg #138068 - Ignore Mactheriverrat modified |
9/8/2017 7:39:28 PM Next week will be another start of a new candle on the weekly baring World War 3 we should see more upside- Will post another weekly chart early next week zgnx made a weekly EMA(5) cross on Tuesday and it took off on the daily- |
| pthomas215 1,251 posts msg #138069 - Ignore pthomas215 |
9/8/2017 8:03:32 PM oh no doubt. when you look at these charts it is clear...with a rounded belly, not even crossed yet on 2 day chart...BZUN hasnt even started yet really. but like JCP today, may require patience.... |
| ron22 255 posts msg #138070 - Ignore ron22 |
9/8/2017 9:22:35 PM Mac, thank you for the detail and logic in your 9/8 post. It helps me see where you are coming from and how to paper trade this filter. PT, thank you for taking the time to locate this filter. I have a lot of studying and paper trading to do; however, you both pointed me in the right direction. Thanks again. |
| mahkoh 1,065 posts msg #138077 - Ignore mahkoh modified |
9/9/2017 5:03:37 PM If you like the BZUN chart you may also appreciate JKS. |
| StockFetcher Forums · Stock Picks and Trading · BZUN WEEKLY buy signal | << 1 2 3 4 >>Post Follow-up |