| StockFetcher Forums · General Discussion · Interesting new site I stumbled upon . | << 1 2 3 4 5 ... 14 >>Post Follow-up |
| Mactheriverrat 3,178 posts msg #137309 - Ignore Mactheriverrat modified |
8/3/2017 1:29:11 AM Then again maybe it does with a EMA(9) remount - Guess I'll mess with it tomorrow /* macdemal and macfast code belongs to FOUR who came up with it */ set{macdema1, cema(macd(10,24),8)} set{macdfast1, macd fast line(10,24,8)} draw macdfast1 on plot macdema1 draw macdfast1 line at 0.00 /* ZxZ is number of consecutive days MACD Fast Line(10,24,8) above (+)/below(-) previous MACD Slow Line(10,24,8) */ set{ZZb,days( MACD Fast Line(10,24,8) is above MACD Slow Line(10,24,8) 1 day ago,250)} set{ZZa,days( MACD Fast Line(10,24,8) is below MACD Slow Line(10,24,8) 1 day ago,250)} set{ZxZ, ZZa - ZZb} and add column ZxZ {Z_x_Z} do not Draw ZxZ Set{cntmacd10248,count( MACD Fast Line(10,24,8) > MACD Slow Line(10,24,8) 1day ago,1)} draw cntmacd10248 Set{cntmacd10248b,count( MACD Fast Line(10,24,8)< MACD Slow Line(10,24,8) 1day ago,1)} draw cntmacd10248b SSW showed up on a Ema(9) above ema(9) one day ago filter It had a ppo cross on the Charting wealth setup 2 day on the 1st and a DO cross today with all weekly indicators positive Daily SF chart 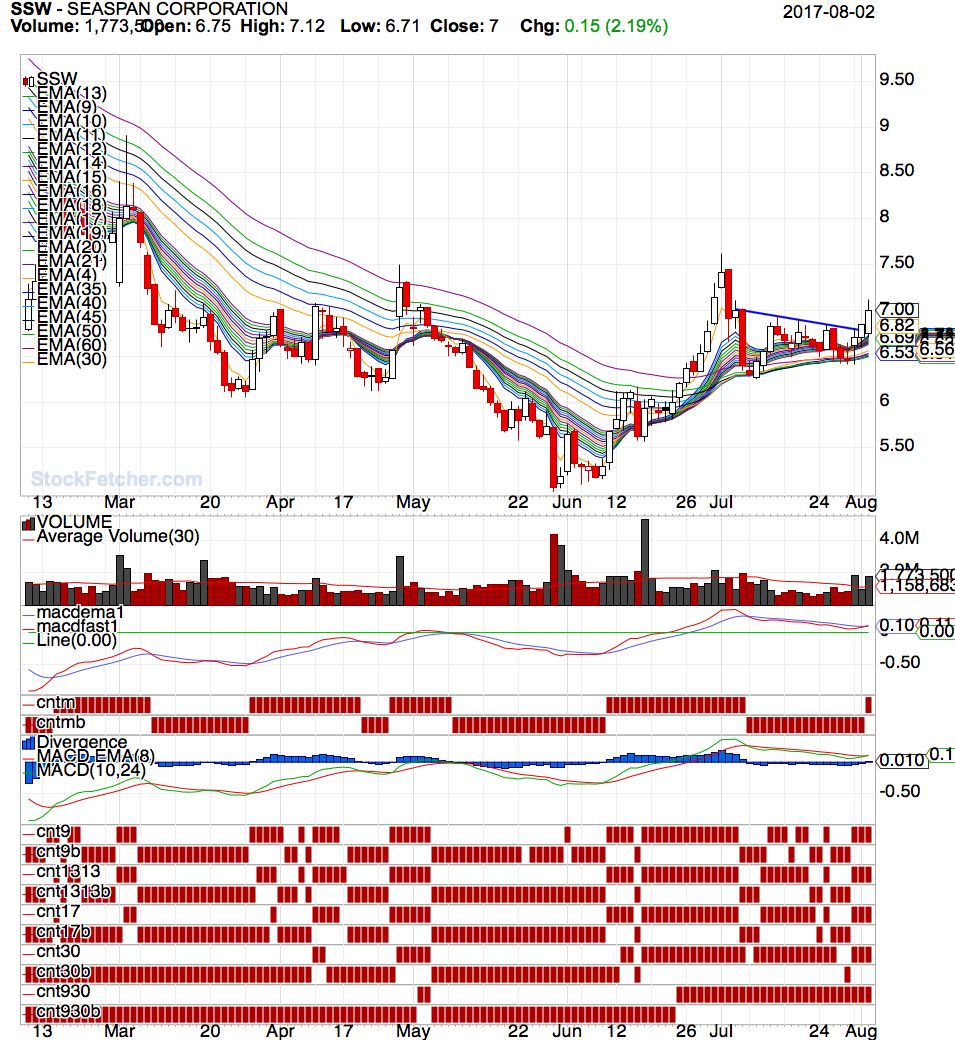 |
| graftonian 1,089 posts msg #137327 - Ignore graftonian |
8/3/2017 3:36:19 PM John, Thanx for the info on SSW, it confirms that my attempt at coding a Derivitive Oscillator might be somewhere near right. I have been tinkering with a filter utilizing PSAR, weekly PSAR, and ADX. This week it has returned CZZ,BSBR,GRPN,OVAS,KGC,VG,TOPS,FIT,ECR. it seems to be a pretty good feed into this system. If you are interested in my work, I'll post it here. Chachi |
| Mactheriverrat 3,178 posts msg #137329 - Ignore Mactheriverrat |
8/3/2017 4:31:32 PM Go ahead and posts as extra info is always good. I what this guy at Charting wealth will say about TLT tonight on his daily video . |
| graftonian 1,089 posts msg #137337 - Ignore graftonian |
8/3/2017 7:28:56 PM |
| Mactheriverrat 3,178 posts msg #137340 - Ignore Mactheriverrat modified |
8/3/2017 8:37:13 PM Like all trading setups which there are millions and that there is NO Holy Grail |
| graftonian 1,089 posts msg #137422 - Ignore graftonian |
8/7/2017 1:32:01 PM John, I took a small shot at DXTR this morning , as it seemed to fit both the guppy and the Trading Wealth Plan. Got in at .28 and it is paying off so far, but the volume is getting a little thin. Think I'll put a stop in at .305 and call it beer money. |
| graftonian 1,089 posts msg #137425 - Ignore graftonian |
8/7/2017 2:55:36 PM John, I am trying to learn this Trading Wealth system, but sometime I feel like a monkey staring at a wristwatch. Follow me through on this one: CSTM Weekly PPO and DO > 0 on June 9, so we watch and wait. Comes July 12 and 2 day PPO and DO cross above 0 We check 4 hr chart, and it is in agreement, so we pull the trigger at open on July 13. Am I correct so far? When to exit? John, thanks for your tme, Chachi |
| mahkoh 1,065 posts msg #137433 - Ignore mahkoh modified |
8/7/2017 5:55:10 PM If this derivative oscillator is DO(14,5,3,9), shouldn't it be coded like this? You don't really want to use "r" as a variable since SF will recognize that as pivot points (r1,r2 etc) |
| pthomas215 1,251 posts msg #137439 - Ignore pthomas215 |
8/7/2017 7:01:26 PM Chachi, the dude in the video was saying the price percent oscillator is even more important than the derivative oscillator. by chance would you know how to program that? I find the derivative oscillator to be a great indicator for me so far. Paul |
| pthomas215 1,251 posts msg #137441 - Ignore pthomas215 |
8/7/2017 7:23:04 PM meaning, the guy in video seems to have the entry point being the price percent oscillator crossing above the EMA(8). |
| StockFetcher Forums · General Discussion · Interesting new site I stumbled upon . | << 1 2 3 4 5 ... 14 >>Post Follow-up |