| StockFetcher Forums · Filter Exchange · Need Help - Buy the Dip | << >>Post Follow-up |
| sixerwrong@gmail.com 12 posts msg #148877 - Ignore sixerwrong@gmail.com |
8/14/2019 4:49:59 AM Hello to all, i'm new to trading and was wondering if someone could help me out. I wish for 2 filters: 1. to buy the dip on long term uptrend 2. to sell the correction on a long term downtrend thanks in advance kris |
| four 5,087 posts msg #148886 - Ignore four modified |
8/14/2019 9:56:45 AM The Guide is here: https://www.stockfetcher.com/help/?id=100379 1. DIP What do you consider a long trend? What do you consider a dip? What will be your EXIT for a profit? What will be your EXIT for a loss? Will you pyramid on the original trade? Here is somewhere to start... modify as you need... 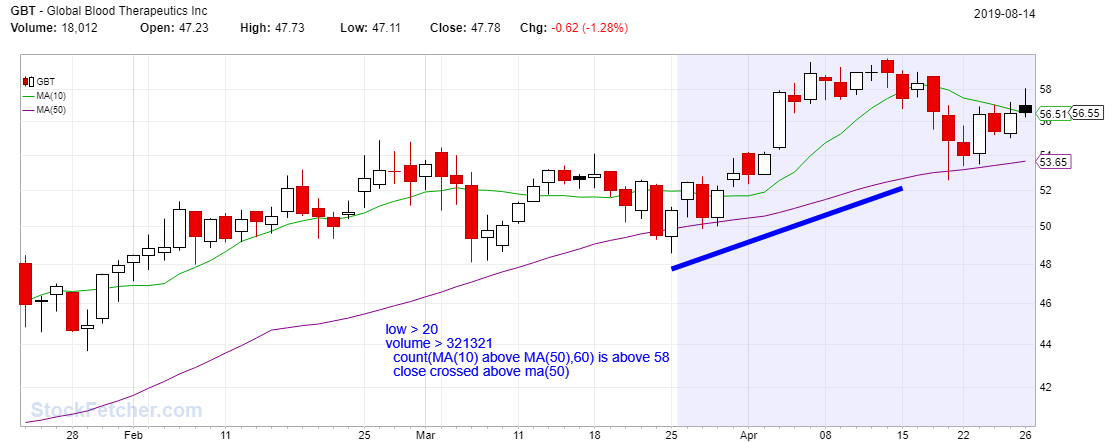 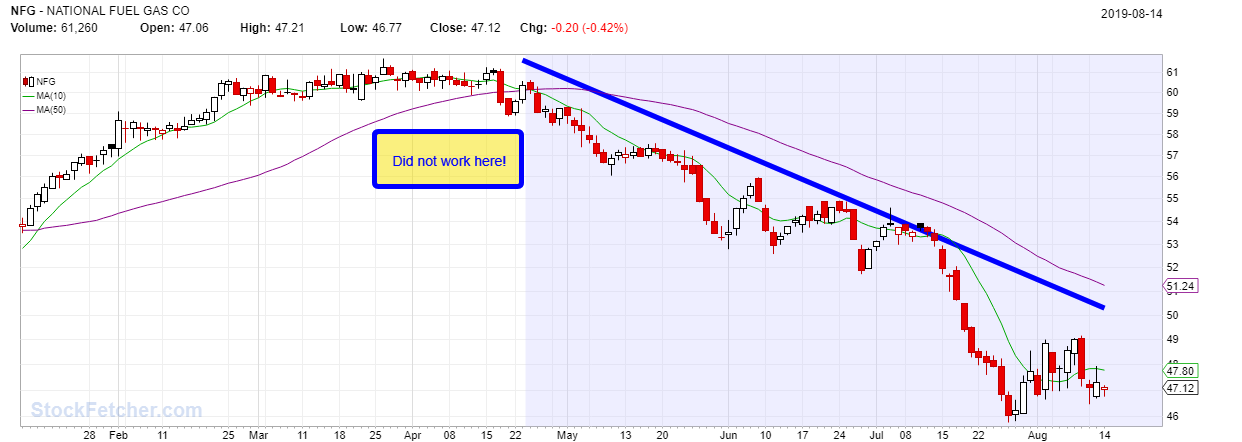 |
| KSK8 561 posts msg #148887 - Ignore KSK8 |
8/14/2019 10:13:47 AM This might be something you'd like; Buy on the close & sell when RSI(4) crosses above 55 credit; Larry Connor's book |
| karennma 8,057 posts msg #148893 - Ignore karennma modified |
8/14/2019 1:06:19 PM Hi Four< I like that 10/50 Xover, but I can't write the filter for it. (NO surprise there!) show stocks where wma(10)crossed below wma(50) in the last 2 days chart-time 15 days What's the problem? (I know in some scripts you can use ",1" to specify in the last ONE day.) |
| four 5,087 posts msg #148895 - Ignore four modified |
8/14/2019 1:51:54 PM karennma, show stocks where wma(10) crossed below wma(50) within the last 2 days chart-time 15 days set{cross, count(wma(10) crossed below wma(50),1)} draw cross ---------------- The filter below is in the image I posted above... it is not the same as you were identifying in your previous post. This filter is a close cross over of ma50.. it is not a ma10 cross over of ma50. And the ma10 is above ma50 for many days before the close cross over of ma50. |
| sixerwrong@gmail.com 12 posts msg #148908 - Ignore sixerwrong@gmail.com |
8/15/2019 11:20:47 AM hi all...first of all thank you for the immediate replies...i'm very new to this and still learning...i did not quite understand the filters posted (still have to learn alot :) )....i wanted something like this: close 2 days ago crossed above MA(50) and close 1 day ago is above close 2 days ago and MA(50) is above MA(100) and MA(100) is above MA(150) and MA(150) is above MA(200) did i write it good and is this a good filter for searching dips in uptrends? thanks again kris |
| four 5,087 posts msg #148917 - Ignore four modified |
8/15/2019 3:53:34 PM sixer, Almost any filter that follows the trend works until it doesn't. In other words, How will you handle the taking of gains and taking of losses? What percent of the portfolio is each stock allowed to represent? If you only trade a trend that goes up... are you going to sit for possibly months or years not trading during a recession when the trend is down... or will you trade both sides of the market? Many forget that there are times when the trend is neither up or down and just floats sideways. What will you do then? Thus, There are three trends and only being able to play one of them is a recipe for frustration and losses when the other two present themselves. |
| sixerwrong@gmail.com 12 posts msg #148957 - Ignore sixerwrong@gmail.com |
8/20/2019 3:32:24 AM yeah im still learning...right now i'm ok in buying on uptrend and sell on downtrend. still learning consolidation as i had some false signals :( |
| mahkoh 1,065 posts msg #148959 - Ignore mahkoh |
8/20/2019 5:02:16 AM http://www.stockfetcher.com/forums2/Filter-Exchange/BUYING-THE-DIP/113409/-1/113409 |
| StockFetcher Forums · Filter Exchange · Need Help - Buy the Dip | << >>Post Follow-up |