| StockFetcher Forums · Filter Exchange · Have i done this correctly? Can anyone take a look see and let me know please. | << >>Post Follow-up |
| pa247 143 posts msg #148172 - Ignore pa247 |
6/16/2019 3:44:42 PM /* The formula for calculating the Dorsey Relative Strength indicator is quite simple: RSD= ( close / close_index ) * 100 The value of the indicator is calculated each day by dividing the price of the security by the price of the index. t is easy to see that if this indicator rises the stock is outperforming the market and if it declines, the stock underperforms the market. The rising or declining is independent of the actual rise or decline of the stock itself. The Relative Strength only expresses how the stock performs relative to the market. It is perfectly possible for a rising stock to have a declining relative strength: if the market rises harder, the division will lead to smaller numbers each day.*/ close above 5 volume above 123456 not etf optionable set{SP1, ind(SPY, close)} /*- this creates a variable called SP1 and is current price of SPY */ set{RSD1, close / sp1} set{RSD, rsd1 * 100} /* the formula of Mansfield indicator is a bit more complicated than the regular Dorsey RS, but it is worth the read: RSM = (( RSD(today) /sma(RSD(today), n)) - 1 ) * 100 Where: RSD = Relative Strength (Dorsey) SMA = Simple moving average over n days. So, the Dorsey Relative Strength value is divided by its own n-day moving average and then one is subtracted. If we look at the daily time frame and use 200 for n, this means: We get 0 if the RSD is exactly equal to its 200 day moving average. We get a negative number if the RSD is below its 200 day moving average. We get a positive number if the RSD is above its 200 day moving average.*/ /* Usage: As with the regular ( Dorsey ) RS, you can use Mansfield RS to examine if a stock performs better than the market. Only the rising or declining of the indicator matters for this. Stan Weinstein used the indicator only on weekly charts with 52 as the parameter value for n. He insisted that break outs out of a base had to go together with rising relative strength. The Mansfield RS needs to be rising and close to or above 0. This indicator has the advantage over the Dorsey RS that the values are below or above the 0 line. This allows us to screen for stocks with a MRS value above 0. When we see that the MRS is far above 0 and has been above 0 for some time, we have found a stock that outperforms the market heavily. We can buy this kind of stock when dips occur. */ set{weeklyrsm1, cma(rsd,52)} set{weeklyrsm2, rsd /weeklyrsm1} set{weeklyrsm3, weeklyrsm2 - 1} set{weeklyRSM, weeklyrsm3 * 100} add column weeklyRSM crossed below 0 add column sector draw weeklyrsm draw weekly ma(30) offset 0 |
| graftonian 1,089 posts msg #148174 - Ignore graftonian |
6/16/2019 5:58:42 PM Paula, thanx for the post, looks good to me. One question. In your example you add the weekly MA(30), and Mac is using the weekly WMA(30). Was this your intent? Graf |
| pa247 143 posts msg #148176 - Ignore pa247 |
6/16/2019 9:05:16 PM Graftonian.... no, meant to use the wma. |
| Mactheriverrat 3,178 posts msg #148177 - Ignore Mactheriverrat modified |
6/16/2019 11:05:34 PM So far in the Weinstein book he talks of using wma which is weighted moving average. ma - the slowest moving average ema - stronger moving average wma - moving average on steroids Example- Submit 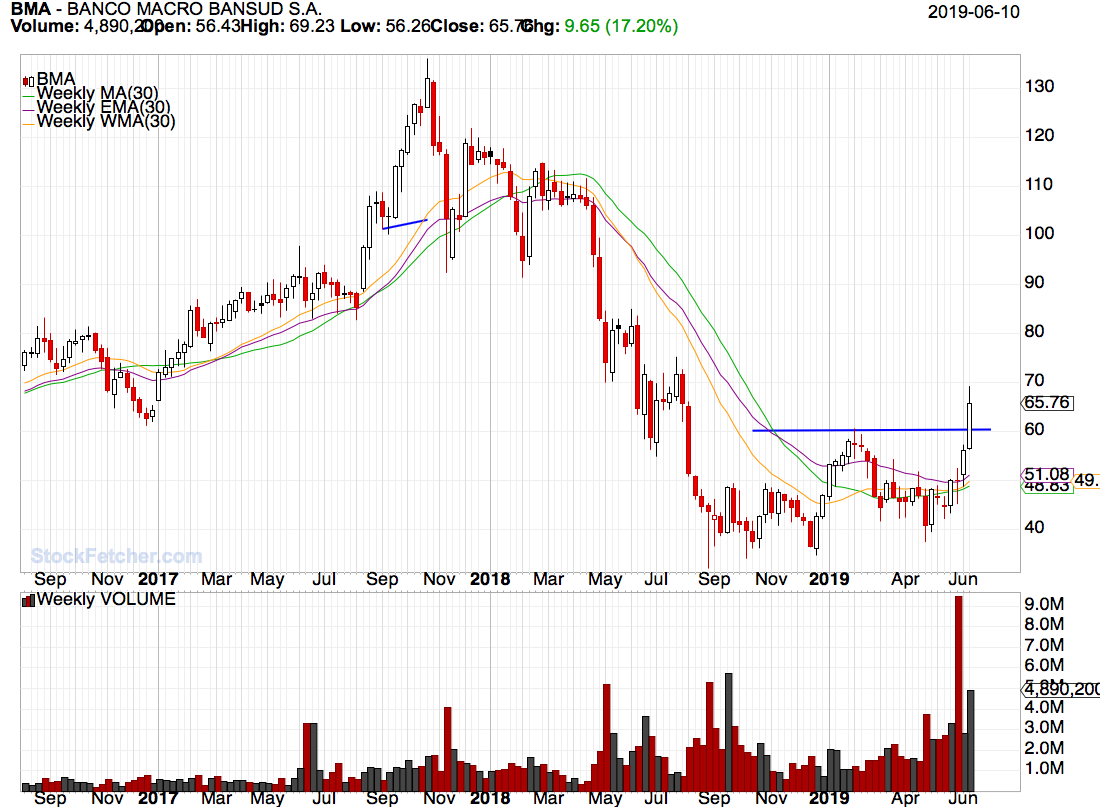 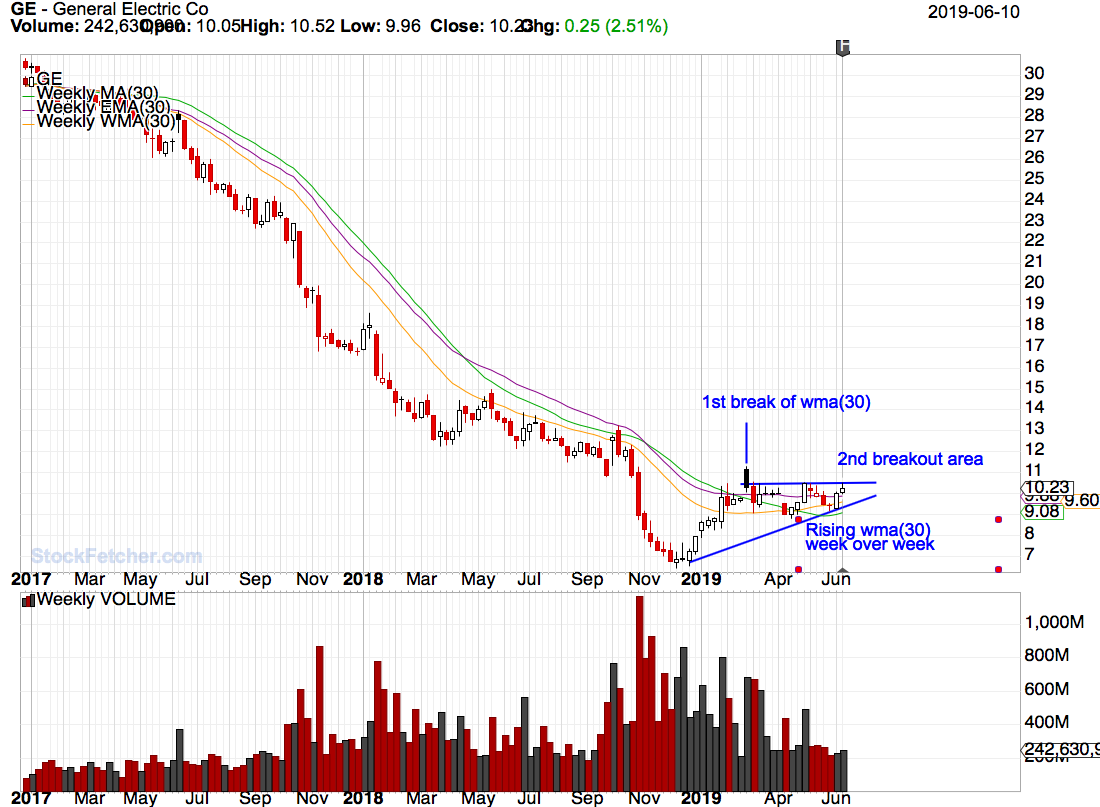 |
| StockFetcher Forums · Filter Exchange · Have i done this correctly? Can anyone take a look see and let me know please. | << >>Post Follow-up |