| StockFetcher Forums · Filter Exchange · Filter results only when market is above ma(200) | << 1 2 3 >>Post Follow-up |
| snappyfrog 753 posts msg #161219 - Ignore snappyfrog |
7/11/2024 11:25:05 PM GENI, WOOF are two examples I see. Is this what you are looking for? |
| hballa 36 posts msg #161220 - Ignore hballa |
7/12/2024 7:45:07 AM Thanks so much snappyfrog, yes I am looking for setup like WOOF between May 1- May 6 TSL between June 20 - 25 GENI -- your modified script already captured :) |
| snappyfrog 753 posts msg #161222 - Ignore snappyfrog |
7/12/2024 9:54:16 AM So you want the price near the MA(10) and not the MA(200)? |
| hballa 36 posts msg #161223 - Ignore hballa |
7/12/2024 11:45:23 AM Hi Snappyfrog, Thanks for patiently helping. when you use your last script close is between 2 and 15 and add column ema(200) and add column ema(200) divided by close and close is near ema(10) ] and please pick TOYO and replace LCID there, I am looking for setup like that to capture stocks like LCID :) I noticed these 3 things for LCID =================================== Price above MA 10 and EMA 10 both MACD ema(9) and (12,26) above divergence line Williams %R(14) > -20 (green color) |
| hballa 36 posts msg #161224 - Ignore hballa |
7/12/2024 11:52:05 AM last 3 days data would be fine on these 3 conditions Price just above MA 10 and EMA 10 both MACD ema(9) and (12,26) above divergence line Williams %R(14) > -20 (green color) |
| snappyfrog 753 posts msg #161226 - Ignore snappyfrog |
7/12/2024 5:52:46 PM If this is what you are looking for, then maybe this will help. 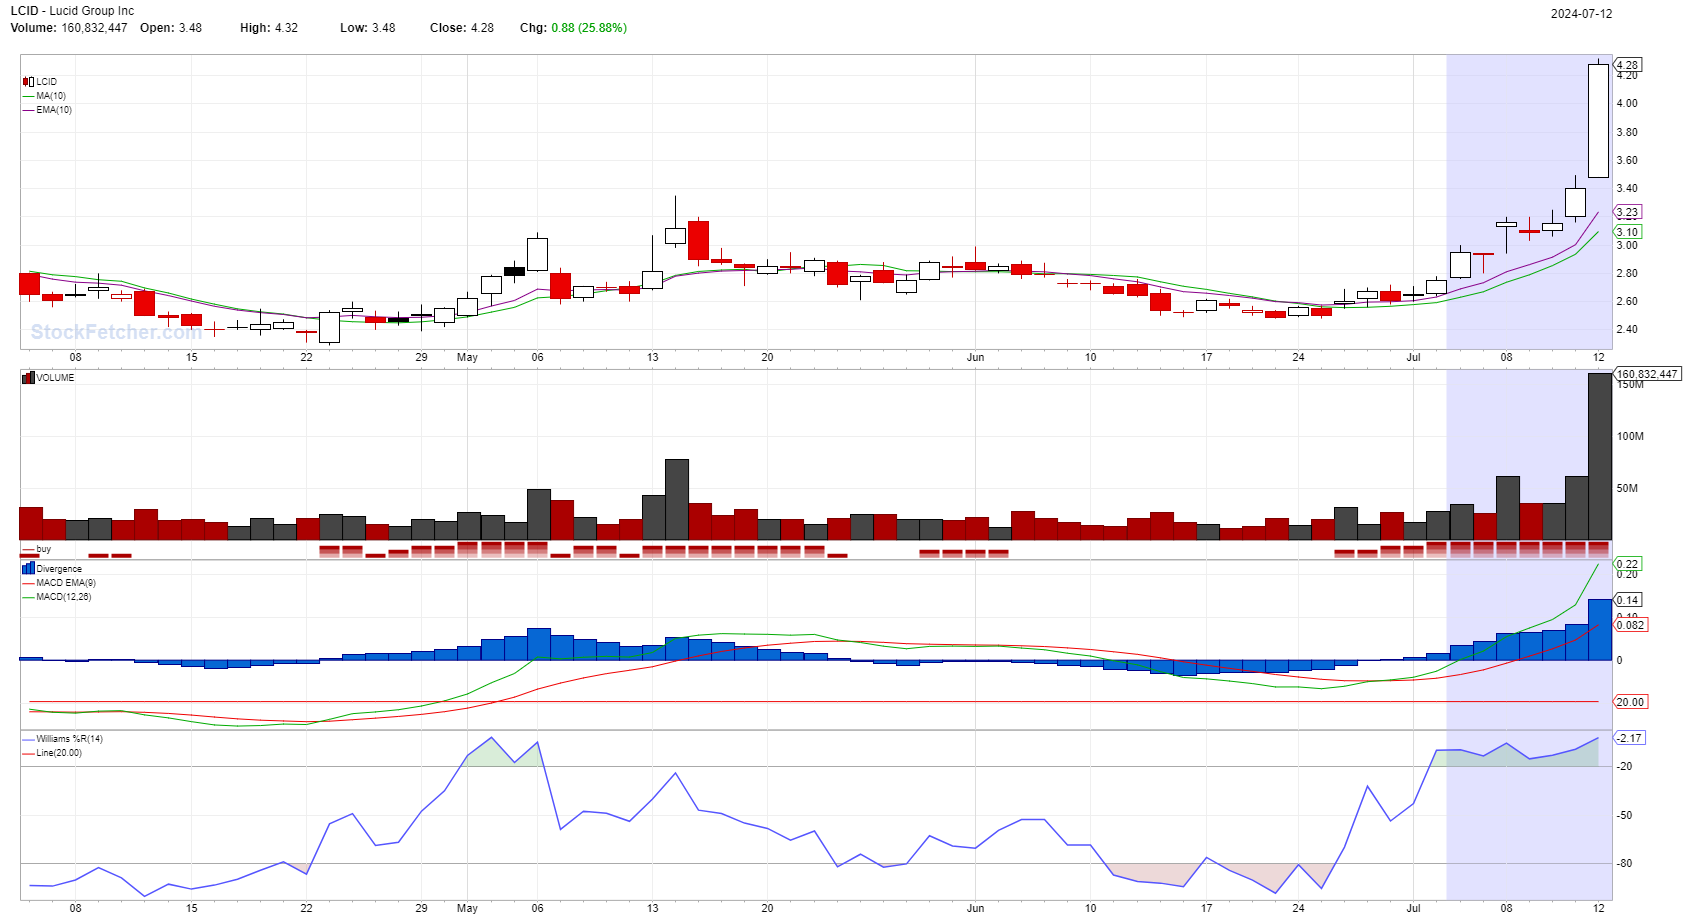 |
| hballa 36 posts msg #161228 - Ignore hballa |
7/12/2024 8:39:52 PM Thanks so much, This is what I am looking for :) if you have any good script other than this for penny day trade stocks that are below $7? Can you please share? |
| snappyfrog 753 posts msg #161229 - Ignore snappyfrog modified |
7/12/2024 8:42:56 PM Click on my name at left of message or anyone else's name to see what they have posted in the past. |
| hballa 36 posts msg #161230 - Ignore hballa |
7/12/2024 10:38:22 PM sure thanks again |
| hballa 36 posts msg #161234 - Ignore hballa |
7/14/2024 2:44:40 PM Hi Snappyfrog, Sorry to bother you again, in your script, I tried to modify to add last 3 days condition, but no luck. Can you please help ======================== set{var1, count(price above ma(10),1)} set{var2, count(price above ema(10),1)} set{var3, count(MACD Histogram(12,26,9) above 0,1)} set{var4, count(Williams %R(14) above -20,1)} set{var5, var1 + var2} set{var6, var3 + var4} set{buy, var5 + var6} draw buy > 3.99 and buy 1 day ago < 3.99 ==>3 buy signals last 3 days draw ma(10) ==>price above MA 10 last 3 days draw ema(10) ==>price above EMA 10 last 3 days draw MACD Histogram(12,26,9) draw Williams %R(14) line 20 ============= and buy 1 day ago < 3.99 ==>3 buy signals last 3 days draw ma(10) ==>price above MA 10 last 3 days draw ema(10) ==>price above EMA 10 last 3 days =============== |
| StockFetcher Forums · Filter Exchange · Filter results only when market is above ma(200) | << 1 2 3 >>Post Follow-up |